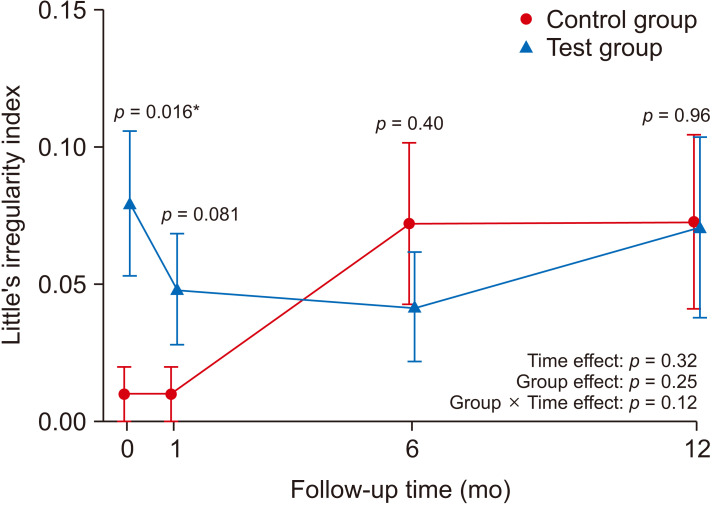
Figure 3.
Evolution of Little’s irregularity index in the control and test groups. Group mean values and standard error bars displayed at each time point with p-values obtained by two-sided unpaired t-test. p-values of time effect, group effect and interaction effect on “Little Irregularity Index” measures over time obtained by Generalized Linear Mixed effects Models (GLMM).
*p < 0.05.

