
Figure 2.
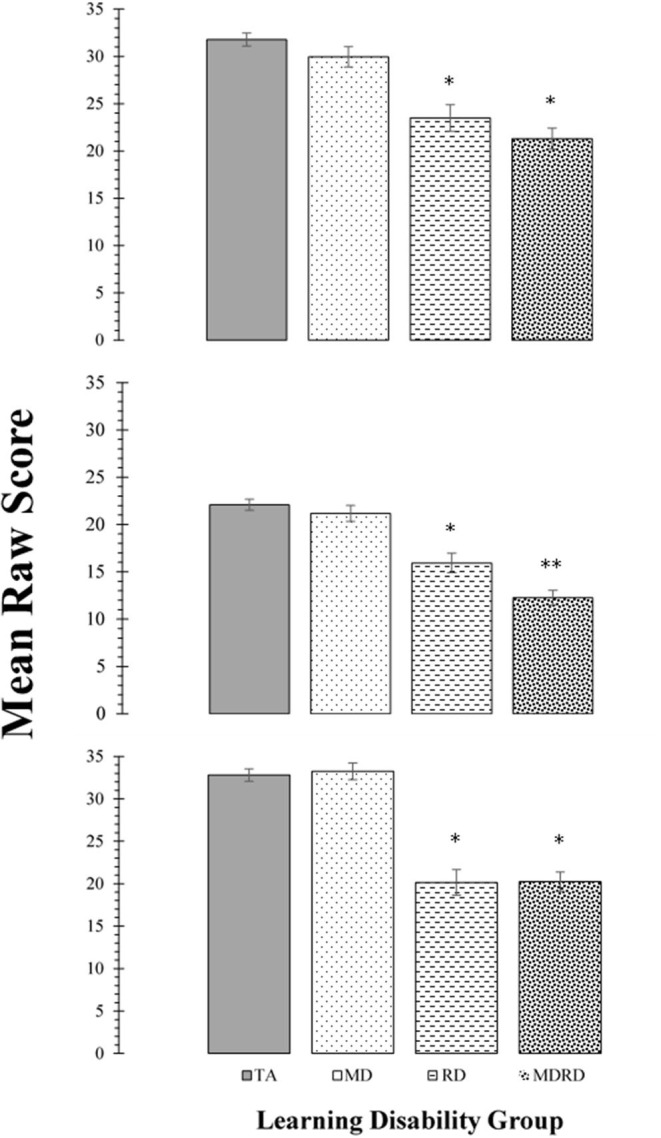
Top Panel: Mean scores for the Rosner Auditory Analysis task. Middle Panel: Mean scores for the Pseudowords Phoneme Deletion task Bottom Panel: Mean scores for the WRMT-R Word Attack subtest. For all panels, bars represent one standard errors. Asterisks summarize the results of post hoc Tukey test comparisons: “*” indicates a significant difference from the typical achievement (TA) control group at p < 0.05; “**” indicates a significant difference from the reading disability (RD) group at p < 0.05. TA > RD (Rosner Auditory Analysis: 8.29 [CI: 4.31 to 12.27]; Pseudowords: 6.15 [CI: 3.02 to 9.29]; Word Attack: 12.65 [CI: 8.53 to 16.76]; all p's < 0.01). TA > MDRD (Rosner Auditory Analysis: 7.30 [CI: 7.30 to 13.64]; Pseudowords: 9.84 [CI: 7.34 to 12.43]; Word Attack: 12.56 [CI: 9.27 to 15.84]; all p's < 0.01). For all other comparisons, RD = MD = MDRD.