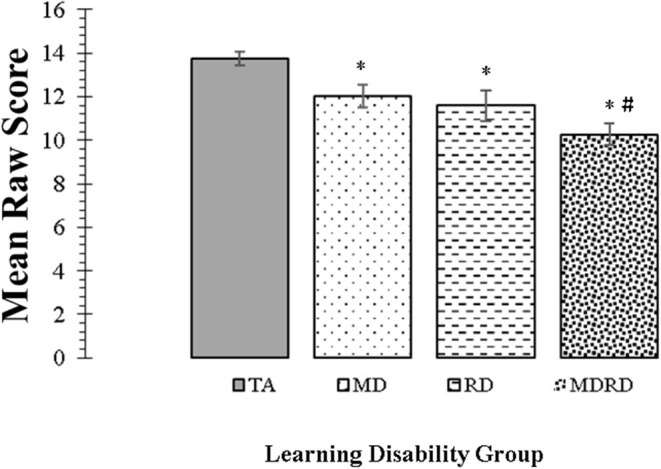
Figure 3.

Mean scores for the KeyMath Interpreting Data subtest. Bars represent one standard errors. The symbol “*” indicates a significant difference from the typical achievement (TA) control group at p < 0.05 on post hoc Tukey test. The symbol “#” indicates a marginally significant trend at 0.05 <p < 0.10 on post hoc Tukey test. TA > MD (1.72, [CI: 0.07 to 3.36], p = 0.04). TA > RD (2.16, [CI: 0.25 to 4.07], p = 0.02). TA > MDRD (3.47, [CI: 1.95 to 4.99], p < 0.01). RD = MD. RD = MDRD. # MD > MDRD (1.75, [CI: −0.08 to 3.59], p = 0.068).
