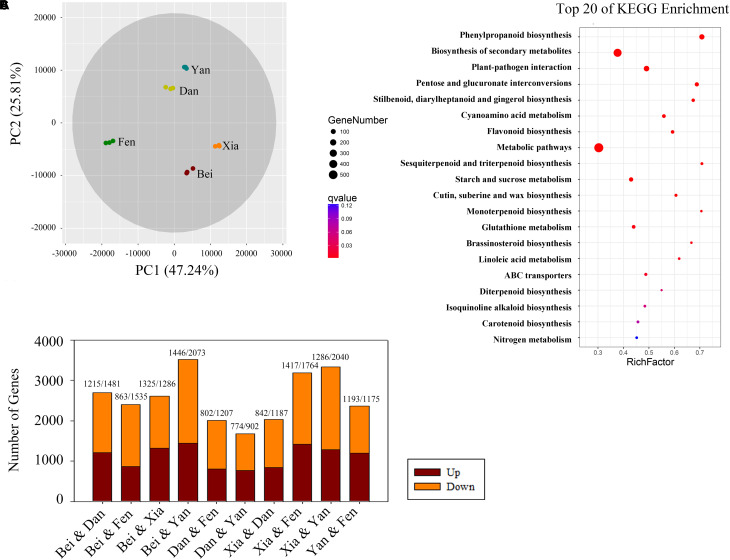
FIGURE 4.
Bioinformatics analysis of differentially expressed genes in the transcriptomes of the five varieties. (A) PCA score plot for the five varieties. (B) Numbers of differentially expressed genes (genes with a fold change > 4) between each pair of varieties. The numbers of upregulated and downregulated genes are shown above the columns. (C) Top 20 pathways in the KEGG enrichment analysis. The number of genes in each category is equal to the point size. The point color represents the q-Value.

