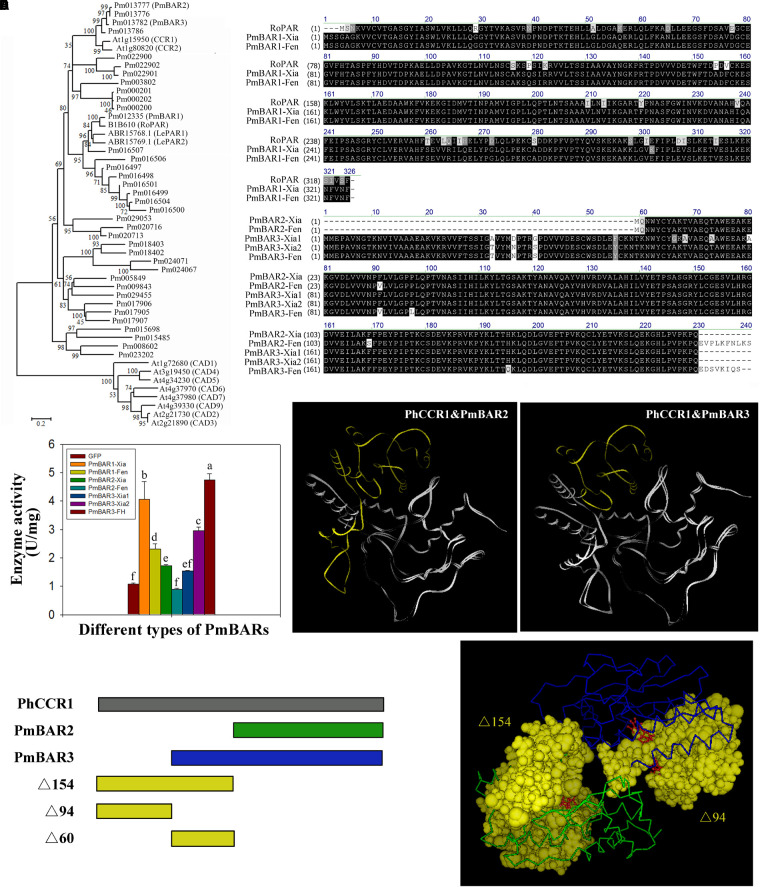
FIGURE 6.
Comparison of the sequences and enzyme activity of PmBARs from the different varieties. (A) Comparison of the PmBAR amino acid sequence in the “Xiangruibai” and “Fenghou” varieties. RoPAR, PAR in rose. RoPAR was used as a reference sequence to identify PmBARs in P. mume. (B) Phylogenetic tree of PmBARs, PARs, CCRs and CADs. The tree was generated using MEGA 6 software with the neighbor-joining method. The bootstrap values (%) are shown next to the branches. The branch lengths were determined by the evolutionary distance. (C) Enzyme activity of PmBARs from the “Xiangruibai” and “Fenghou” varieties. The data are presented as the mean values of three biological replicates ± SDs. The data are presented as the mean values of three replicates ± SDs. A sample expressing GFP was used as a negative control. (D) Comparison of protein tertiary structures between PhCCR1 and PmBARs. The underlying N-terminal deletion sequences PmBARs compared with PhCCR1 are marked in yellow. PhCCR1, CCR1 in petunia. (E) Model of NADP+ binding to the N-terminus of PhCCR1 (PDB ID: 4R1S). Schematic diagram of the protein structures of PmBARs and PhCCR1 (left), in which different colors reflect the different segments marked in the tertiary structure (right). NADP+ is shown in red and in a ball-and-stick representation.

