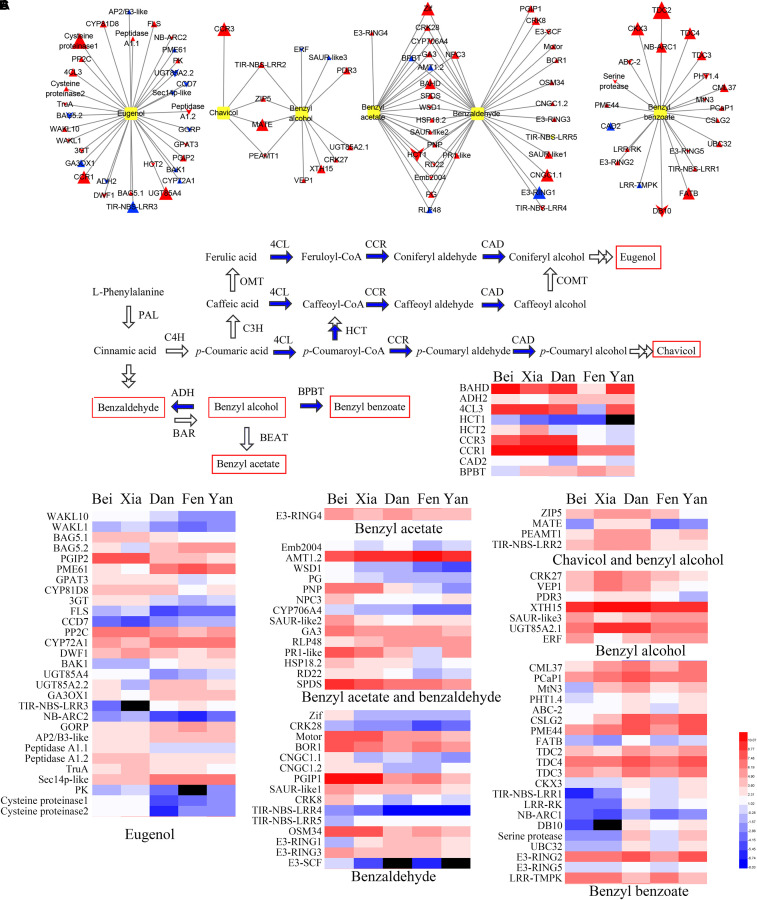
FIGURE 7.
Connections between genes and floral scent metabolites and heat maps of gene expression. (A) The connections between highly associated genes and six metabolites were assessed by correlation analysis. Yellow boxes indicate metabolites. Triangles indicate upregulated genes in blooming flowers, while chevrons indicate downregulated genes in blooming flowers. The sizes of the triangles and chevrons represent the log2 (fold change) ratios in flowers to buds. Red symbols indicate positive correlations, and blue symbols indicate negative correlations. (B) Biosynthesis pathway and heat maps of the expression of the highly correlated enzyme-coding genes. The blue arrows indicate steps for which the enzyme-coding genes were identified in the correlation analysis. Red rectangles indicate the metabolites detected in intracellular pools. (C) Heat map of the expression of other genes (non-enzyme-coding genes) that were highly correlated with the six metabolites. In the heat maps, the values were normalized by log2 transformation. Red and blue represent high and low transcript expression, respectively. Black represents undetectable expression.

