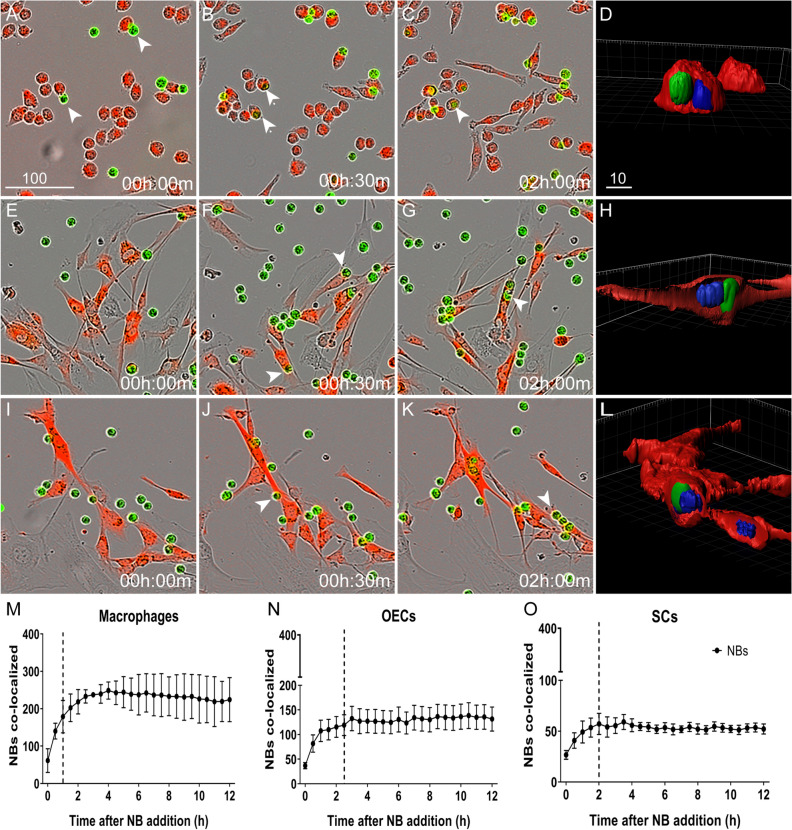
Figure 2.
Engulfment of necrotic cells by macrophages, OECs and SCs. Example images of macrophages (J774A.1 cells) (A–D), OECs (E–H) and SCs (I–L) challenged with necrotic cells pre-labelled with cell tracker (CMFDA green), at a NB:live cell ratio of 4:1. OECs/SCs expressed DsRed; macrophages were labelled with CellTracker red dye. Arrows indicate cells establishing contact with NBs. Localisation of internalized NBs within cells was confirmed by confocal imaging and 3D rendering (D, H, L). (M–O) Graphical representation of the time-course for necrotic cell internalization by macrophages (M), OECs (N) and SCs (O). The Y-axes shows the number of NBs (green fluorescence) co-localizing with cells (red fluorescence) i.e. internalized NBs. The number of NBs co-localizing with cells at the various time-point were compared to background NB-cell co-localization levels (time zero). Stars shows the time-points at which the number of NBs co-localizing with cells were significantly different from background levels. *P ≤ 0.05, **P ≤ 0.01, ***P ≤ 0.001 (two-way ANOVA with Sidak’s multiple comparison test). Data represents mean ± SEM. n = 3 biological repeats × 3 technical replicates × 4 FOV/well (n = 300–400 cells/FOV). Scale bar: 100 µm in A–C, E–G, I-K and 10 µm in D, H, L).

