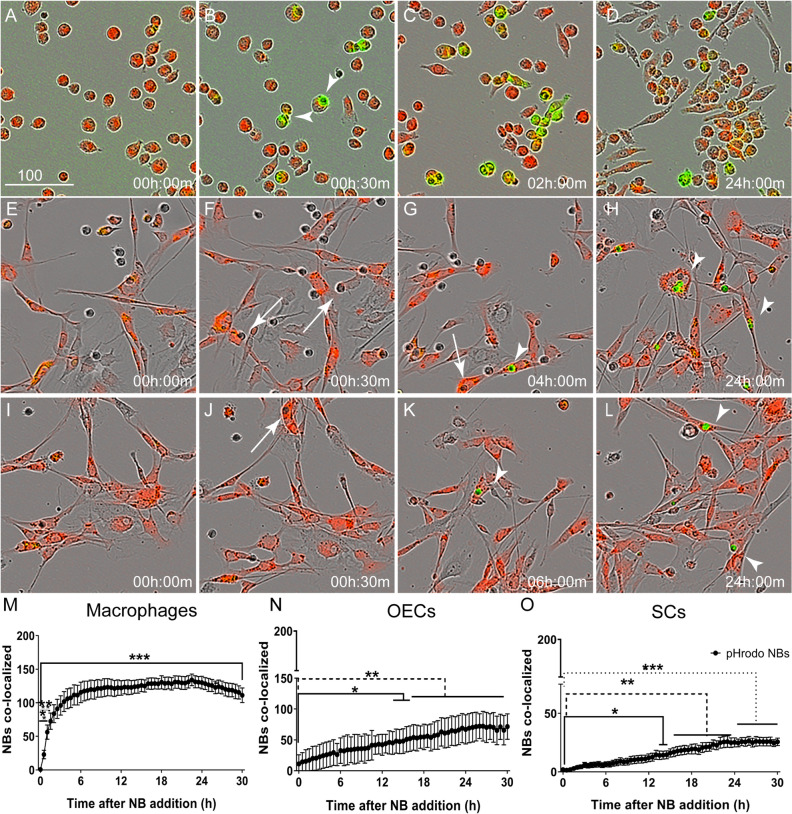
Figure 3.
Trafficking of necrotic bodies to endosomes-lysosomes in macrophages and glia. (A–L) Example images of macrophages (J774A.1 cells) (A–D), OECs (E–H) and SCs (I–L) (red) with NBs inside endosomes/lysosomes (green, arrowheads). Necrotic cells were tagged with pHrodo STP dye (green) that only fluoresces in acidic pH (i.e. in intracellular endosomes/lysosomes); NBs not in endosomes/lysosomes do not fluoresce (examples shown by arrows in F–H). (M–O) Graphical representation of NB appearance within endosomes-lysosomes (pHrodo-tagged) between macrophages (M), OECs (N) and SCs (O). The Y-axis shows the number of NBs in endo/lysosomes (green fluorescence) co-localizing with cells (red fluorescence) i.e. internalized NBs. The number of pHrodo-tagged NBs co-localizing with cells at the various time-points were compared to background levels (time zero); stars shows time-points at which there was a significant difference from background *P ≤ 0.05, **P ≤ 0.01, ***P ≤ 0.0001 (two-way ANOVA with Sidak’s multiple comparison test). Data represents mean ± SEM. n = 3 biological repeats × 3 technical replicates × 4 FOV (n = 300–400 cells/FOV).

