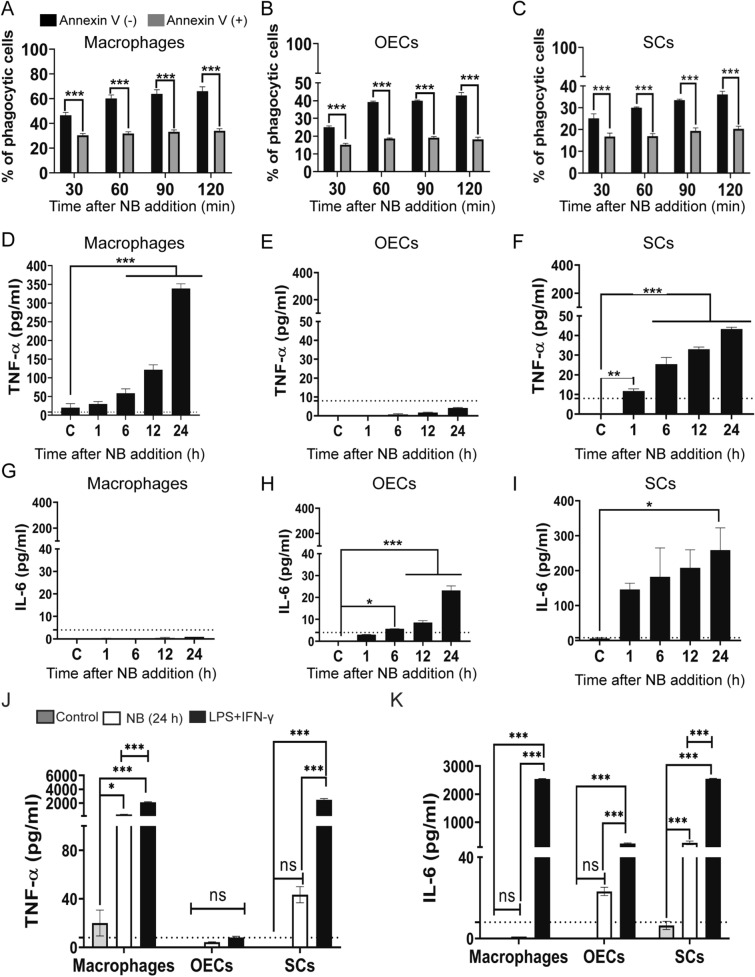
Figure 6.
Internalization of necrotic cells by macrophages, OECs and SCs is dependent on PS recognition and results in the production of TNF-α. (A–C) Blockage of PS by annexin V impairs NB internalization. Macrophages (A), OECs (B) and SCs (C) were exposed to fluorescently labelled necrotic cells (CMFDA dye, green) which had, or had not, been pre-incubated with annexin V. After 2 h, internalization of necrotic debris was determined. ***P ≤ 0.0001 (two-way ANOVA with Sidak’s multiple comparison test). Data represents mean ± SEM. n = 3 biological repeats × 3 technical replicates × 4 FOV (% phagocytic cells: cells with necrotic bodies/total cells × 100). (D–F) Production of TNF-α (G–H) Production of IL-6 following exposure to NBs by macrophages, OECs and SCs. At different time-point post exposure to NBs, the TNF-α and IL-6 levels produced by the three cell types were measured using ELISA (D, G: macrophages, E, H: OECs, F, I: SCs). **P ≤ 0.01, ***P ≤ 0.0001 (one-way ANOVA, Dunnett’s multiple comparison post-hoc test). Production of TNF-α (J) and IL-6 (K) in macrophages, OECS and SCs when exposed to NBs or a strong inflammatory stimulus (LPS + IFN-γ) for 24 h. **P ≤ 0.01, ***P ≤ 0.0001 (one-way ANOVA, Dunnett’s multiple comparison post-hoc test). Detectable TNF-α range of kit was 8–1000 pg/ml; IL-6: 4–500 pg/ml (dotted lines). Data represents three biological replicates with two technical replicates per assay experiments ± SEM.

