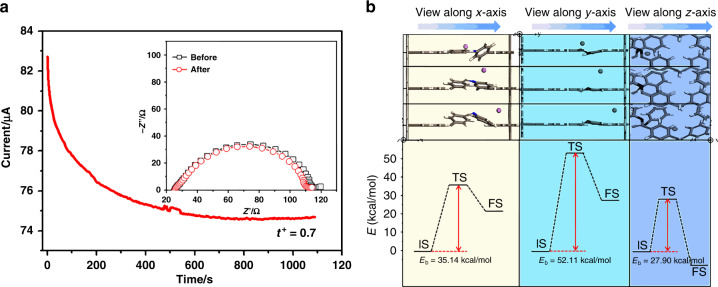
Fig. 2. The lithium ion migration characterization of 3D-Sp-COF.
a The chronoamperometry of the Li/3D-Sp-COF/Li symmetric cells (experiment condition: ambient temperature, potential step of 10 mV). The insets present the EIS before and after polarization at ambient temperature. b Theoretical calculation of Li-ion migration behaviors inside the pore (top) with corresponding energy diagrams (bottom). The initial, transition, and final states are abbreviated as IS, TS, and FS, respectively.

