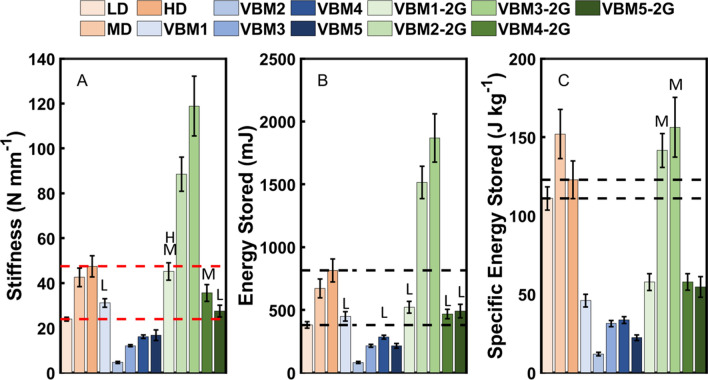
Figure 9.
Quasi-static compression test results for the first and second generation velar bone mimics (VBM). (A) Stiffness, (B) energy stored, and (C) specific energy stored. The error bars indicate ± one standard deviation. The dashed lines indicate the ranges for the EVA foams. The red dashed lines in (A) indicate the imposed stiffness constraint. L—not significantly different from LD EVA foam, M—not significantly different from MD EVA foam, H—not significantly different from HD EVA foam.

