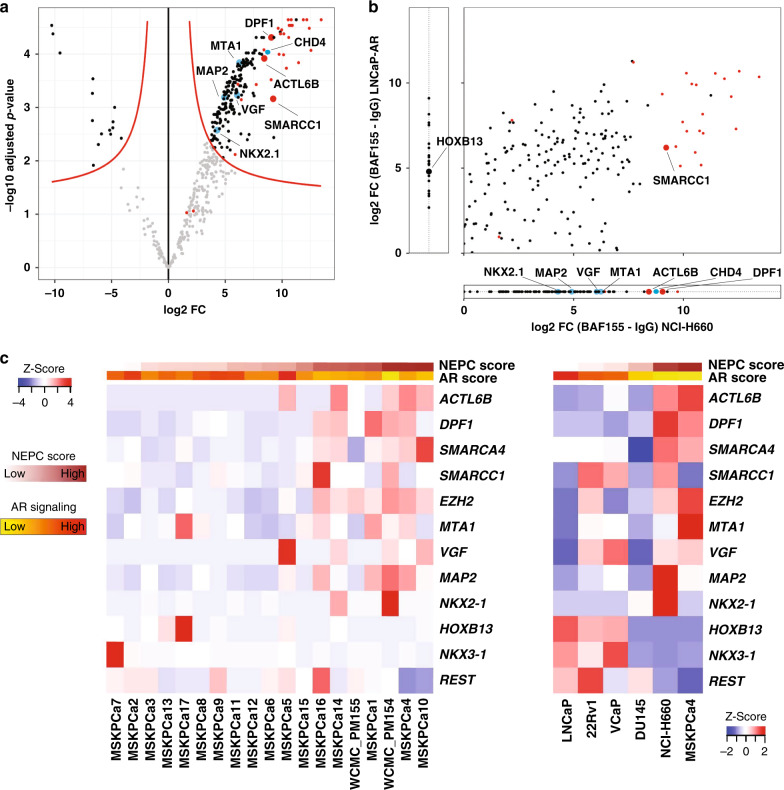
Fig. 4. SWI/SNF associates with different transcriptional regulators in CRPC-NE and in adenocarcinoma cells.
a Volcano plot showing proteins most significantly represented (upper right) in the co-IP using an anti-BAF155 antibody, as compared to IgG isotype control in NCI-H660 (CRPC-NE) cells (pooled data from 3 co-IP replicates). The x-axis represents log2 fold change (FC) values, the y-axis represents −log10 of adjusted p-values. Each dot represents a protein; red dots represent SWI/SNF members, blue dots indicate notable findings. b A qualitative representation comparing proteins associated with SWI/SNF in NCI-H660 (CRPC-NE) and in LNCaP-AR (adenocarcinoma) cells (averaged data from two co-IP experiments). Plotted are log2 fold change values between BAF155 IP and IgG IP in NCI-H660 cells (x-axis) and in LNCaP-AR cells (y-axis), for proteins present in both cell lines with sufficient evidence in each cell line (i.e., if present in two replicates of at least one condition). Proteins plotted outside of the main field represent proteins that were detected exclusively in one of the cell lines. c Heatmap showing RNA-seq expression (FPKM) of prostate cancer 3D organoids (left) and 2D cell lines (right), ordered by increasing NEPC score.

