Figure 2.
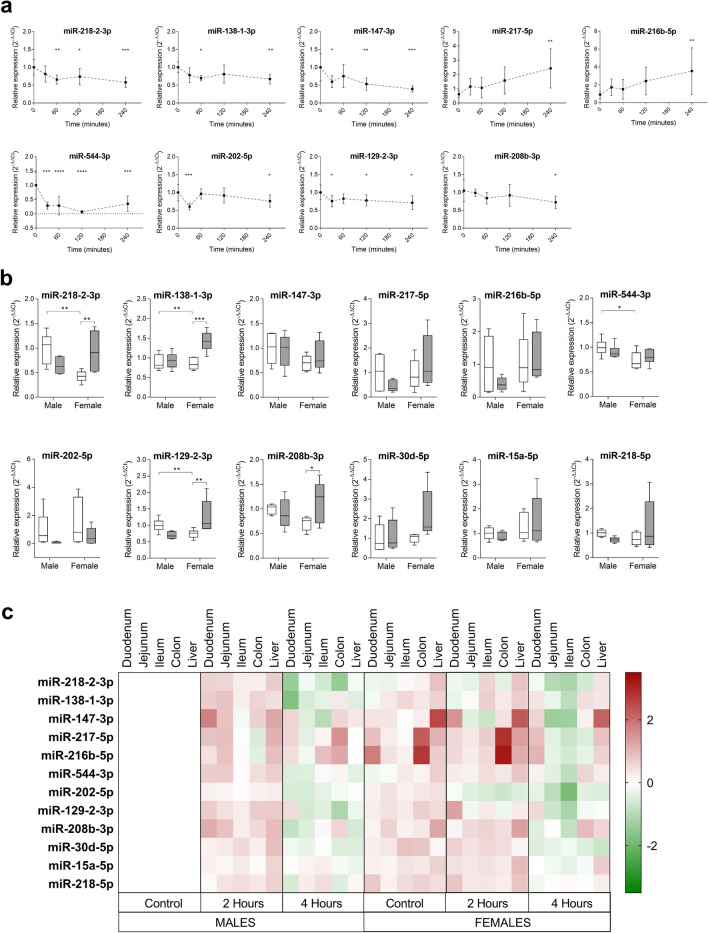
(a) Time-course (30, 60, 120 and 240 min) expression of miRNAs showing significant differences in response to an oral lipid challenge in male C57BL/6 mice. Data are shown as mean ± SD; n ≥ 7. *p < 0.05, **p < 0.001, ***p < 0.0001, compared with t = 0 (control). (b) Relative expression of miRNAs determined 2 h after an oral lipid challenge given orally to male and female wild-type mice (grey), compared to controls (white); n ≥ 10 per group. Two-way ANOVA was followed by Bonferroni’s post-hoc tests for multiple comparisons. *p < 0.05, **p < 0.01, ***p < 0.001. (c) Heatmap of differentially expressed intestinal and hepatic miRNAs 2 and 4 h after an oral lipid challenge compared to controls (male mice); n ≥ 8 per group. Up- and down-regulated miRNAs compared to controls are represented in red and green, respectively.

