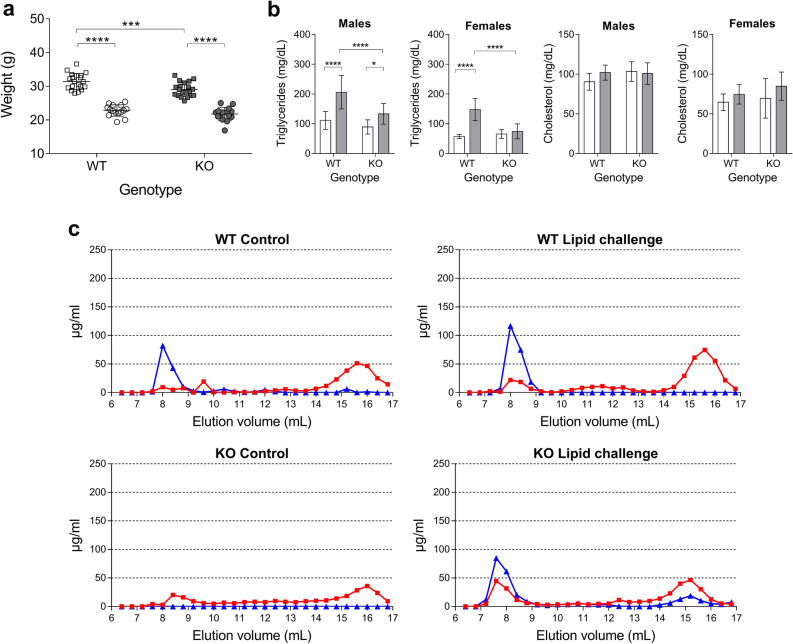
Figure 5.
(a) Males (squares) and females (circles) weight (g) for WT (Dicer1loxP/loxP, Vil-cre(−)) and KO (Dicer1loxP/loxP, Vil-cre(+)) mice; n ≥ 15 per group. Corresponding means and SD bars are shown for each group. Two-way ANOVA was followed by Bonferroni’s post-hoc tests for multiple comparisons. *p < 0.05, **p < 0.01, ***p < 0.001, ****p < 0.0001. (b) Plasma triglycerides and cholesterol levels 2 h after an oral administration of a cholesterol-enriched olive oil solution (grey), compared to controls (water; white); n ≥ 10 per group. Data are represented as mean ± SD. Two-way ANOVA was followed by Bonferroni’s post-hoc tests for multiple comparisons. p < 0.05, **p < 0.01, ***p < 0.001, ****p < 0.0001. (c) Plasma cholesterol (red) and triglycerides (blue) FPLC profile in WT and Dicer1 KO mice submitted to an oral lipid challenge or water (controls), n = 4 per group.

