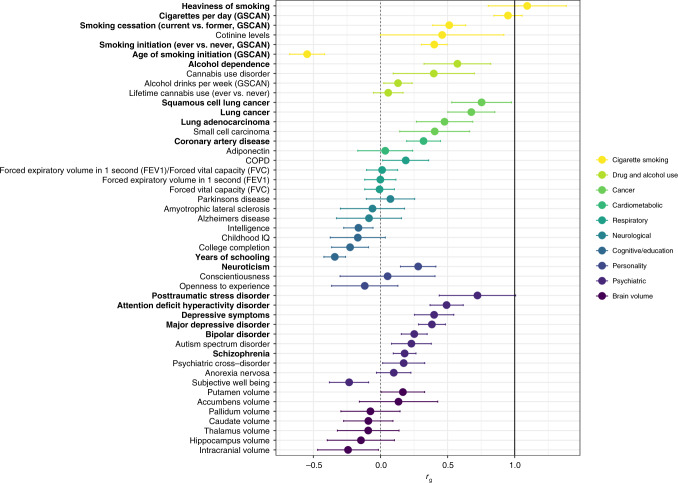
Fig. 3. Genetic correlations of nicotine dependence (ND) with 47 other phenotypes.
Correlations were calculated using linkage disequilibrium (LD) score regression with the iNDiGO European ancestry-specific GWAS meta-analysis results for ND (N = 46,213 biologically independent samples), compared with results made available via LD Hub or study investigators (see Supplementary Table 7 for original references). Phenotypes were grouped by disease/trait or measurement category, as indicated by different colorings. Dots indicate the mean values for genetic correlation (rg); error bars show the 95% confidence intervals; the dashed vertical black line corresponds to rg = 0 (no correlation with ND), and the solid vertical black line corresponds to rg = 0 (complete correlation with ND). Phenotypes with significant correlation with ND are bolded (1 degree of freedom Chi-square test; Bonferroni adjusted p-value <0.05 after accounting for 47 independent tests). Exact p-values are provided in Supplementary Table 7.

