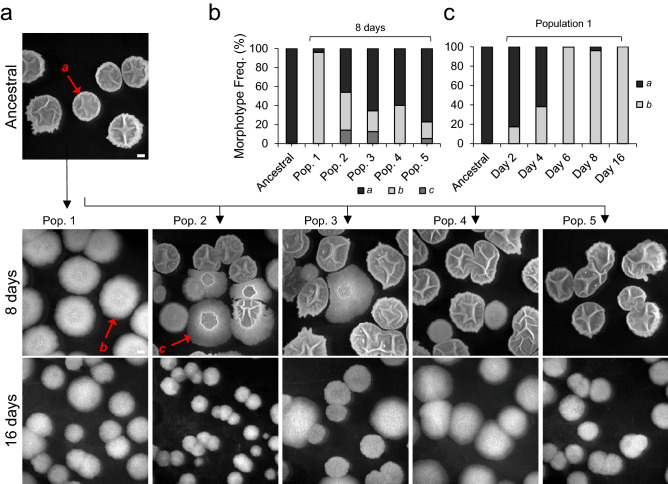
Figure 1.
Changes in colony morphology with domestication. (a) Representative image of the Ancestral colony morphology and the three different types of colony morphology, a, b and c, observed at the eighth and sixteenth days of the domestication experiment in the five evolved populations; (b) frequency of each morphotype in the five populations at day 8 (Ancestral, n = 163; Population 1, n = 407; Population 2, n = 140; Population 3, n = 110; Population 4, n = 132; Population 5, n = 162); (c) frequency of morphotype b in population 1 over time (Ancestral, n = 163; day 2, n = 200; day 4, n = 189; day 6, n = 238; day 8, n = 407). The scale bar represents 1 cm and applies to all panels. For panel b and c, n stands for the number of colonies. This figure was generated with Microsoft Excel 2019 MSO (version 16.0.10366.20016; https://www.microsoft.com) and Microsoft PowerPoint 2019 MSO (version 16.0.10366.20016; https://www.microsoft.com).

