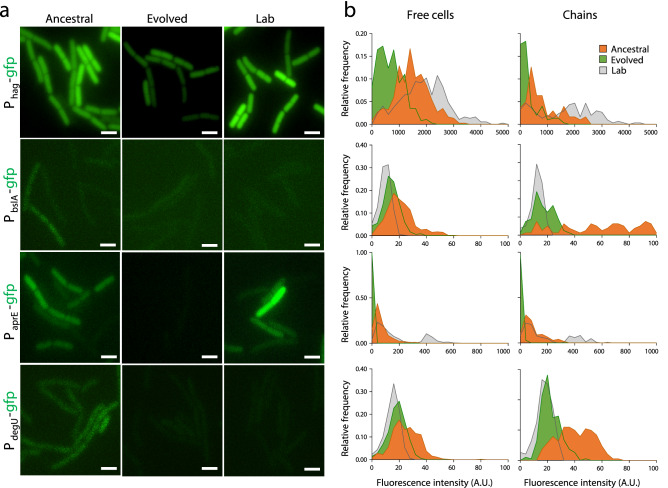
Figure 5.
degUEvo alters the pattern of gene expression at the single-cell level. (a) Representative images of the expression of hag-, bslA-, aprE- and degU-gfp transcriptional fusions in Ancestral, Evolved, and Lab one hour after the onset of stationary phase in LB. The cultures were grown with agitation at 37 °C. Scale bar 1 µm. (b) Relative frequency of expression of transcriptional fusions of the indicated promoters to gfp in the same conditions as above. For the relative frequency of expression of transcriptional fusions in free cells, a total of 371 (hag-gfp), 453 (bslA-gfp), 713 (aprE-gfp), and 561 (degU-gfp) cells from Ancestral, Evolved and Lab were analyzed. For the relative frequency of expression of transcriptional fusions in chains, a total of 150 (hag-gfp), 79 (bslA-gfp), 168 (aprE-gfp), and 191 (degU-gfp) cells from Ancestral, Evolved and Lab were analyzed. This figure was generated with GraphPad Prism 7 software for Windows (version 7.04; https://www.graphpad.com/scientific-software/prism/) and Microsoft PowerPoint 2019 MSO (version 16.0.10366.20016; https://www.microsoft.com).

