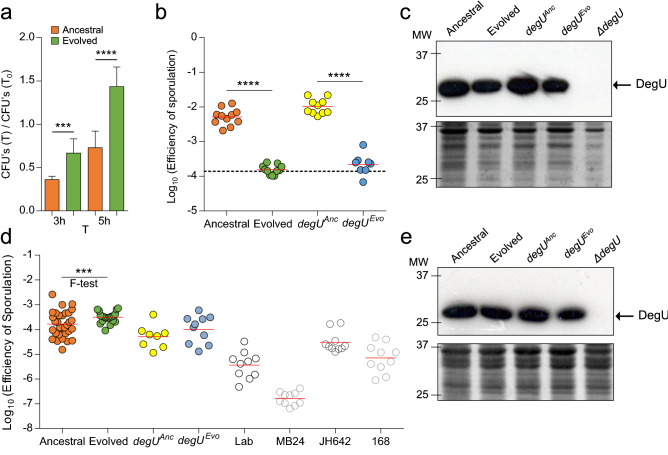
Figure 6.
degUEvo increases survival in the presence of macrophages and changes sporulation efficiency in an environment-dependent manner. (a) Macrophages were infected with Ancestral (n = 9) and Evolved (n = 9) and colony-forming units of both the intracellular and extracellular bacteria obtained by plating at the indicated time points. Unpaired t test with Welch’s correction were used, where ***corresponds to p = 0.001 and **** to p < 0.0001. The error bar represents the standard deviation. (b) Comparison of the sporulation efficiency in RPMI medium between Ancestral (n = 11), Evolved (n = 11), degUAnc (n = 10) and degUEvo (n = 8). The efficiency of sporulation was calculated as the ratio between the heat resistant spore counts and total (viable) cells. The dashed line indicates the average sporulation efficiency for the Ancestral in LB. ANOVA with Tukey’s multiple comparison tests were used, where **** corresponds to p < 0.0001. (c) Accumulation of DegU in Ancestral, Evolved, degUAnc, degUEvo, and the degU insertional mutant in RPMI. (d) Comparison of the sporulation efficiency and variance in LB between Ancestral (n = 31), Evolved (n = 21), degUAnc (n = 8), degUEvo (n = 10), Lab (n = 10) and three other commonly used laboratory strains (MB24, n = 10, JH642, n = 10, and 168, n = 10). For the mean sporulation efficiency, an ANOVA and Tukey’s multiple comparison test was used. For the variance the F test was used. ***p = 0.0002. (e) The levels of DegU are similar between Ancestral and Evolved in LB. Accumulation of DegU in Ancestral, Evolved, degUAnc, degUEvo, and the degU insertional mutant. In (c,e), the cells were collected after growth in RPMI (c) or LB (e) and whole-cell lysates prepared (see “Methods”). Proteins (20 µg) in whole-cell lysates were resolved by SDS-PAGE and subject to immunoblot analysis with an anti-DegU antibody. The arrow shows the position of DegU; the red arrows indicate slightly higher levels of DegU. The panel below the immunoblot shows part of a Coomassie-stained gel, run in parallel, as a loading control. The position of molecular weight markers (in kDa) is shown on the left side of the panels. In panels (b,d) the red line indicates the mean. The full-length blots and full-length Coomassie-stained gels are presented in Supplementary Figure S6. This figure was generated with GraphPad Prism 7 software for Windows (version 7.04; https://www.graphpad.com/scientific-software/prism/) and Microsoft PowerPoint 2019 MSO (version 16.0.10366.20016; https://www.microsoft.com).

