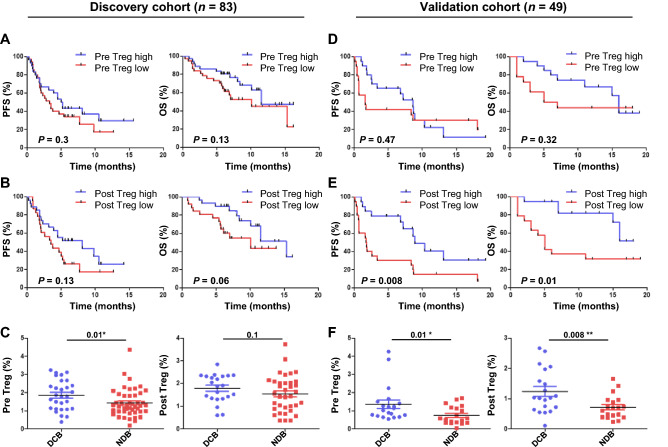
Figure 1.
Progression-free survival (PFS) and overall survival (OS) of patients with advanced NSCLC in association with Treg cell frequencies. (A) PFS and OS in relation to high or low frequencies of Treg cells before and (B) after one week of anti-PD-1 therapy. (C) Treg cell frequencies of durable clinical benefiters (DCB) or non-durable benefiters (NDB) pre- and post-therapy in the discovery cohort (n = 83). PFS and OS in association with Treg cells frequencies (D) before and (E) after one week of anti-PD-1 therapy. (F) Treg cell frequencies of patients with DCB or NDB in the validation cohort (n = 49). Treg cells before the therapy, the median cutoff values of pre-Treg cells were 1.41% (range 0.18–4.36) in the discovery cohort and 0.84% (range 0.04–4.26) in the validation cohort. After the therapy, the median cutoff values of post-Treg were 1.6% (range 0.37–3.73) in the discovery cohort and 0.75% (range 0.11–2.67) in the validation cohort. Center value mean ± SEM of pre-Treg cells are 1.86 (DCB, n = 29), and 1.43 (NDB, n = 46), and post-Treg cells are 1.79 (DCB, n = 22) and 1.54 (NDB, n = 36) in (C). Center value mean ± SEM of pre-Treg cells are 1.365 (DCB, n = 20) and 0.755 (NDB, n = 19), and post-Treg cells are 1.239 (DCB, n = 20) and 0.5211 (NDB, n = 19) in (F). Kaplan–Meier survival curves of patients were plotted with a median cutoff. Statistical significance was determined by log-rank (Mantel-Cox) regression analysis, with the level of significance at P 0.05.

