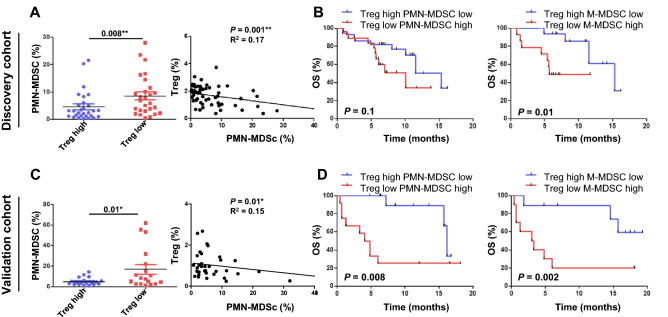
Figure 2.
Correlation of Treg cells and myeloid-derived suppressor cells (MDSCs). (A) polymorphonuclear (PMN)-MDSC frequencies in association with high or low levels of Treg cells and coefficient correlation of Treg cells and PMN-MDSC frequencies in the discovery cohort. (B) Overall survival (OS) when levels of Treg cells are high and PMN-MDSCs are low and when levels of Treg cells are high and monocytic (M)-MDSCs are low compared with low levels of Treg cells and high levels of MDSCs in the discovery cohort. (C) PMN-MDSC frequencies in association with high or low levels of Treg cells and the coefficient correlation of Treg cells and PMN-MDSC frequencies in the validation cohort. (D) OS with high levels of Treg cells and low levels of PMN-MDSCs or M-MDSCs compared with low levels of Treg cells and high levels of MDSCs in the validation cohort. The median cutoff values of Treg cells are 1.6% (range 0.37–3.73) in discovery and 0.75% (range 0.11–2.67) in the validation cohort. The median cutoff values for PMN-MDSCs are 3.9% (range 0.22–70.55) in the discovery cohort and 4.4% (range 0.3–62) in the validation cohort. The median cutoff values for M-MDSCs are 11.1% (range 3–29.34) in the discovery cohort and 6.7% (range 1.5–30.8) in the validation cohort. High Treg cells and low PMN-MDSCs: discovery n = 19, validation n = 12. Low Treg cells and high PMN-MDSCs: discovery n = 18, validation n = 12. High Treg cells and low M-MDSCs: discovery n = 16, validation n = 9. Low Treg cells and high M-MDSCs: discovery n = 14, validation n = 10. The center value is the mean ± SEM. Kaplan–Meier survival curves were plotted with a median cutoff. Statistical significance was determined by log-rank (Mantel-Cox) regression analysis, with the level of significance at P 0.05.

