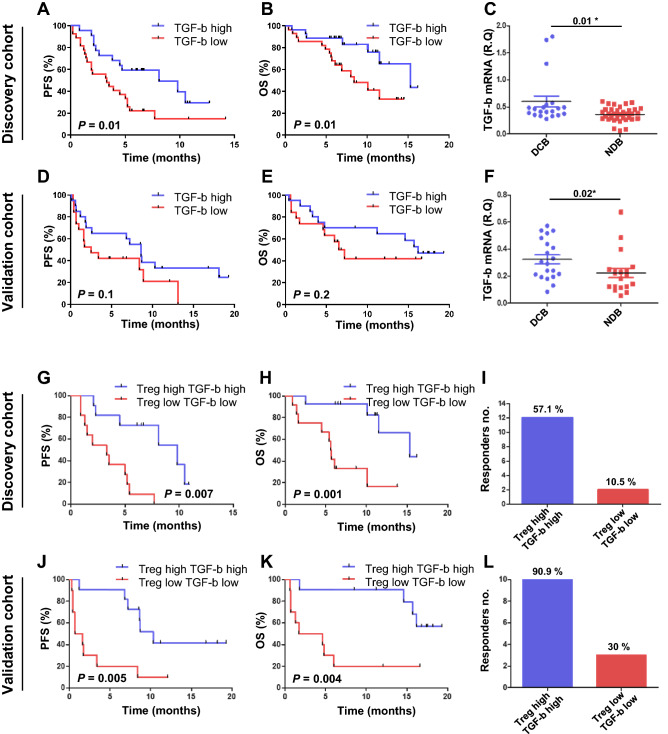
Figure 3.
Cytokine mRNA levels and correlation with Treg cell frequencies. (A) Progression-free survival (PFS) and (B) overall survival (OS) associated with TGF-β mRNA level in the discovery cohort. (C) TGF-β mRNA levels of durable clinical benefiters (DCB) or non-durable clinical benefiters (NDB). (D) PFS and (E) OS associated with TGF-β mRNA level in the validation cohort. (F) TGF-β mRNA levels of DCB or NDB. (G) PFS and (H) OS of patients with both high levels of Treg cells and TGF-β compared to those with low levels of Treg cells and TGF-β. (I) The number of responders with high levels of Treg cells and TGF-β compared to those with low levels of Treg cells and TGF-β in the discovery cohort. (J) PFS and (K) OS of patients with both high levels of Treg cells and TGF-β compared to patients with low levels of Treg cells and TGF-β. (L) The number of responders associated with high levels of Treg cells and TGF-β compared to those with low levels of Treg cells and TGF-β in the validation cohort. The center value is the mean ± SEM. Patient survival curves were plotted with Kaplan–Meier by median cutoff. Statistical significance was determined by log-rank (Mantel-Cox) regression analysis, with the level of significance at P 0.05. R.Q., relative quantification.

