Figure 2.
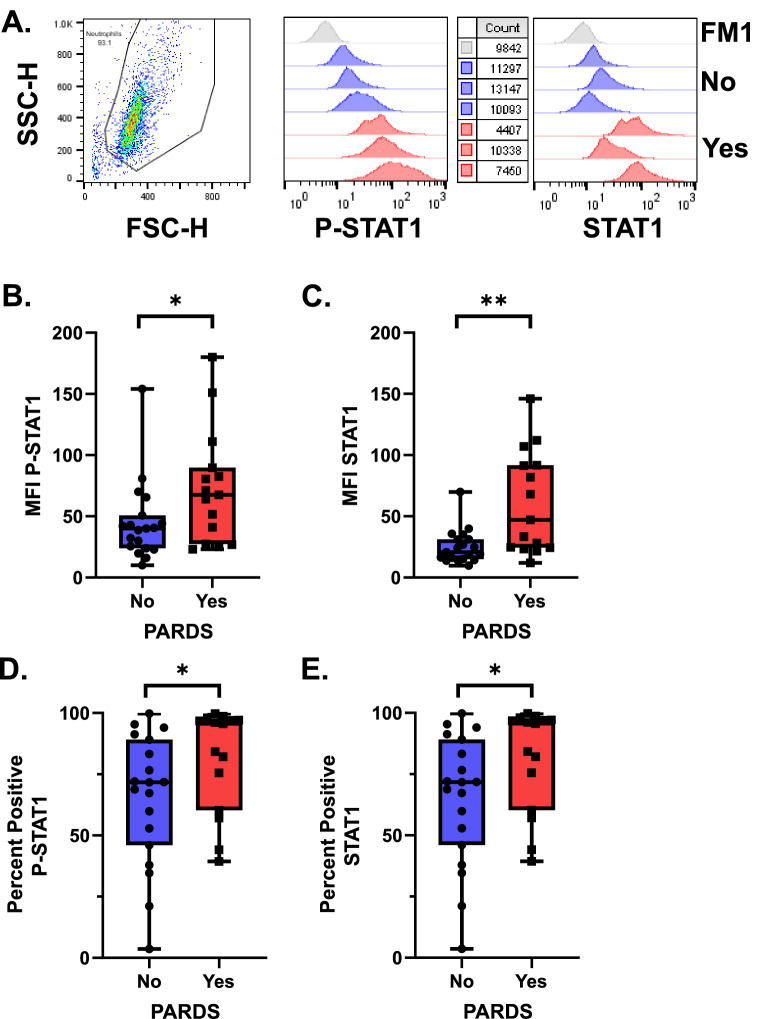
Phosphorylated STAT-1 (P-STAT1 (Y701)) and STAT1 expression in primary airway cells in children with and without PARDS. Cells were gated on forward and side-scatter. Histograms of primary flow data along with cell counts are noted. Histogram data is scaled using the modal function in FlowJo analysis software (A). Boxplots of the mean fluorescence intensity (MFI) of P-STAT1 (B) and STAT-1 (C) along with the percent cells positive for P-STAT1 (D) or STAT1 (E) are shown. The fluorescence minus 1 (FM1) histogram was used to draw the percent positive gate for P-STAT1 and STAT-1, respectively. FM1 (gray histogram), No PARDS (circles/blue boxplot and blue histograms) and PARDS (squares/red boxplot) and red histograms). For all analyses, n = 19 (No PARDS), n = 15 (Yes PARDS). Two-tailed Mann–Whitney U test. *p < 0.05.

