
Figure 4.
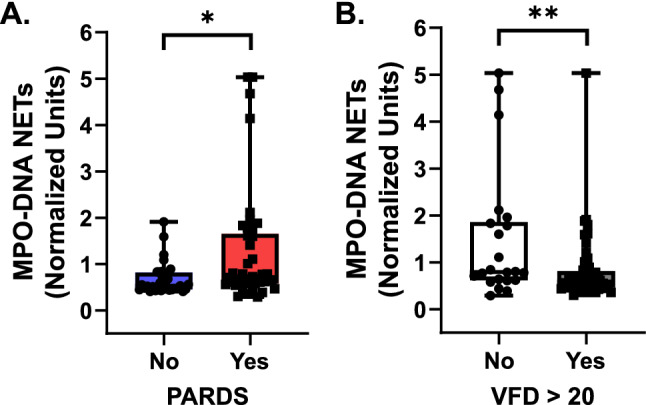
Airway neutrophil extracellular trap (NET) release by PARDS status and ventilator-free days. NET release as measured by MPO-DNA enzyme-linked immunosorbent assay (A) from cell-free tracheal aspirate samples of children without PARDS (blue boxplot, n = 33, where each circle is an individual patient) versus with PARDS (red boxplot, n = 42, where each square is an individual patient). (B) MPO-DNA complexes in tracheal aspirates were stratified by those children who did not have more than 20 ventilator-free days (VFD) (white boxplot, n = 22, where each circle is an individual patient) and those children who did have more than 20 VFD (gray boxplot, n = 53, where each square is an individual patient). Boxplots depict median (line), 25th–75th interquartile range (box edges), and min to max values (whiskers). Values are normalized to a standardized value of 1 and analyzed using a two-tailed Mann–Whitney U test, *p < 0.05, **p < 0.01.