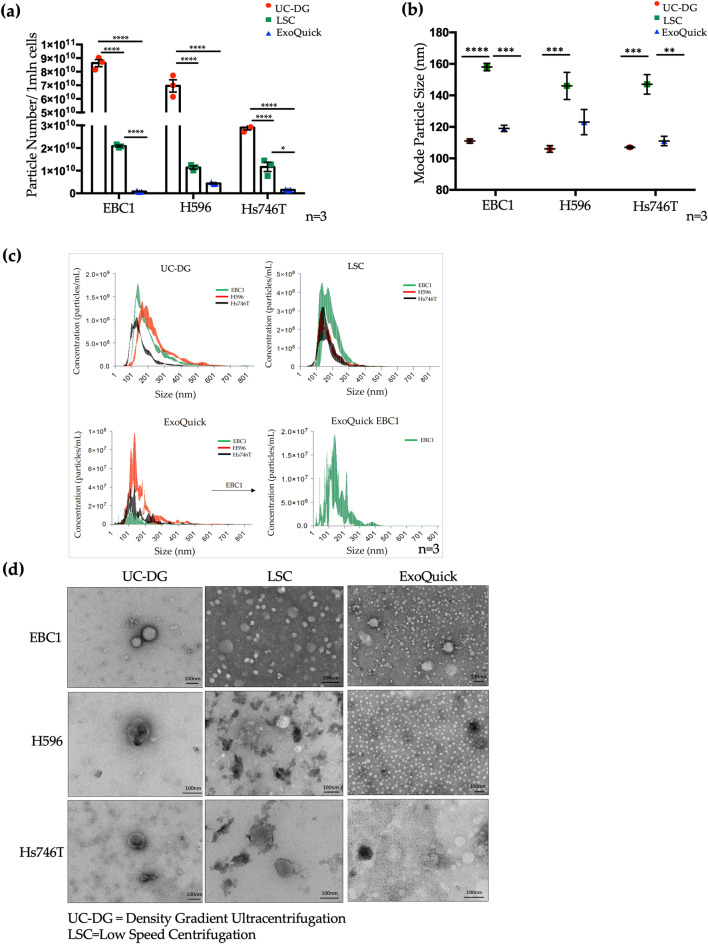
Figure 2.
Quantification of EVs/particles by nanoparticle tracking analysis (NTA). (a) Quantification of EV particle number separated from the three different cell lines CM normalised to 1 × 10⁶ (denoted as 1 mln) of cells. Statistical analysis used ANOVA, where p < 0.05(*), p < 0.0001(****). Graphs represent data as mean ± S.E.M. of ≥ n = 3 repeat analysis on samples from n = 3 biological repeats. (b) NTA estimates mode particle size. Error bars denote mean ± S.E.M of ≥ n = 3 repeat analysis on samples from n = 3 biological repeats. (c) Raw NTA data showing particle range within each sample. Data for EBC1 could not be represented clearly when grouped with data from other cell lines’ EVs, due to not falling within the same range; therefore, presented separately. (d) Characterisation of EVs separated by UC-DG, ExoQuick and LSC using transmission electron microscopy (TEM). Scale bar = 100 nm.

