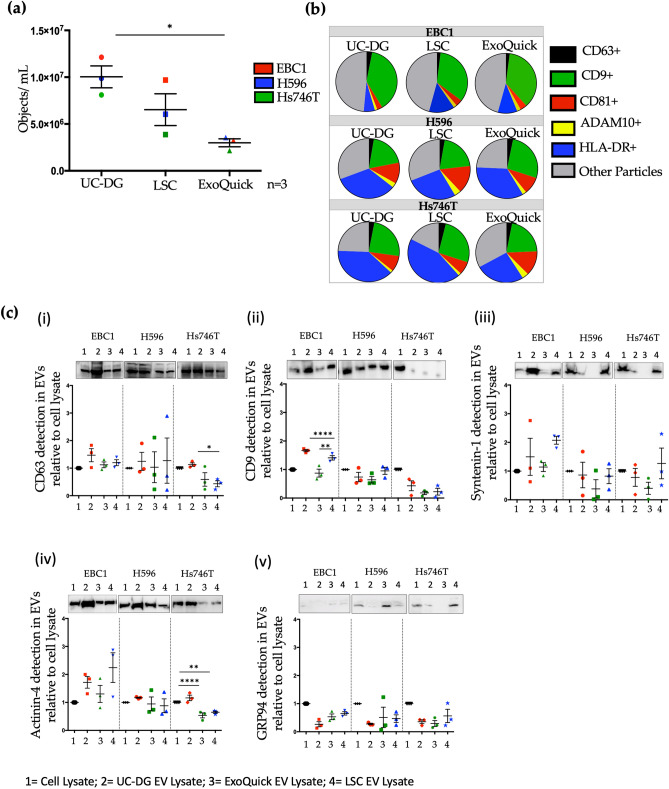
Figure 3.
Analysis of single EVs by IFCM and analysis of some of total EV population by immunoblotting. (a) Quantification, by IFCM, of EVs per mL of sample isolated from EBC1, H596 and Hs746T following EV separation by UC-DG, LSC or ExoQuick. Data is represented as mean ± S.E.M. of ≥ n = 3 repeat analysis, on samples from n = 3 biological repeats. ANOVA was used for statistical analysis; p < 0.05(*). (b) Pie-charts illustrating heterogeneity of EV populations from CM-derived EV samples from EBC1, H596 and Hs746T cells, but separated with three different methods of EV isolation. (c) Immunoblot analysis of key proteins considered to be markers of EVs, according to MISEV2018 guidelines16. Along with other accepted EV markers, included here are tetraspanins CD63 and CD9 analysed used lysates of EV heterogenous pools, which were also evaluated as single intact EVs by IFCM.

