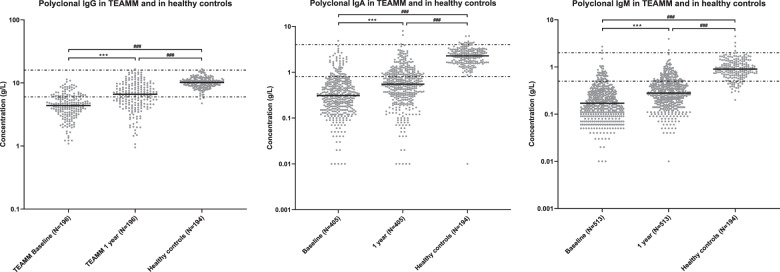
Fig. 1. Levels of polyclonal IgG, IgA and IgM in healthy controls and TEAMM patients without an IgG, IgA and IgM M-protein, respectively, at diagnosis and 1 year post-diagnosis.
Distribution of polyclonal antibody quantified in a healthy cohort and TEAMM patients without an IgG, IgA and IgM M-protein, respectively, at disease presentation (baseline) and at 1 year post diagnosis. The median line for each cohort is shown in black while the 5th and 95th centile of polyclonal normal range (IgG: 6 g/l and 16 g/l; IgA: 0.8 g/l and 4 g/l; IgM: 0.5 g/l and 2 g/l) are represented as discontinuous lines. Statistical significance was calculated using the Wilcoxon and the Mann–Whitney tests and is shown for each pair of data (***p < 0.001, ###p < 0.001).

