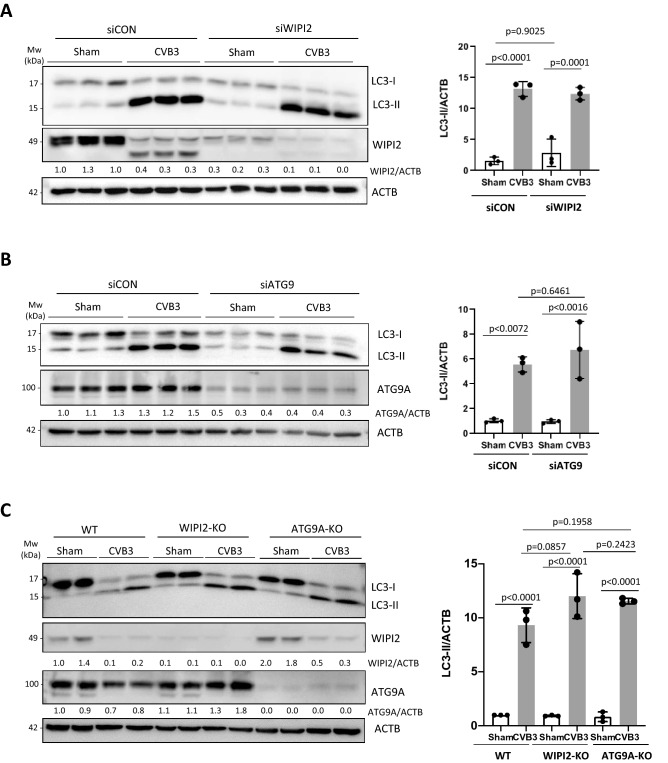
Figure 4.
CVB3-induced LC3 lipidation is independent of ATG9 and WIPI2. (A,B) WIPI2 (A) and ATG9A (B) were transiently silenced in HEK293 cells through siRNA treatment for 48 h. Cells were then sham- or CVB3-infected for 16 h. Western blotting was conducted to verify the knockdown efficiency and to examine LC3 levels. Densitometric results are presented either underneath the blots or in the right panel (mean ± SD, n = 3, analyzed by one-way ANOVA with Tukey’s post-test). (C) WIPI2-KO and ATG9A-KO HEK293A cells, generated through CRISPR-Cas9 gene editing, were sham- or CVB3-infected as above, followed by western blot analysis of LC3, WIPI2, and ATG9A. Densitometry was measured and presented as above.

