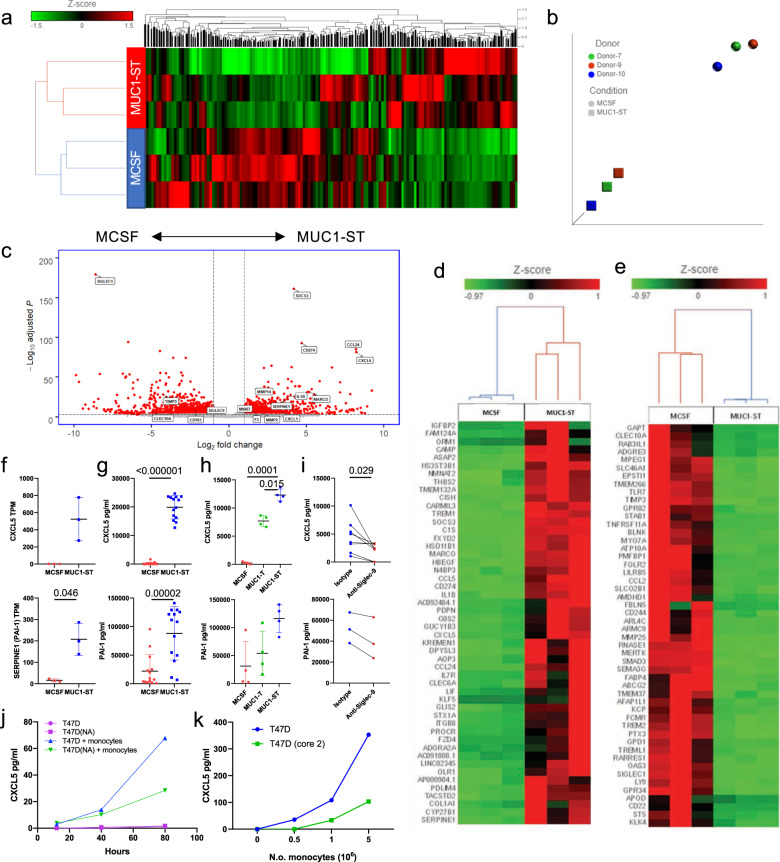
Fig. 3. MUC1-ST induced a particular TAM phenotype.
a Hierarchical clustering of all transcripts from matched MUC1-ST (n = 3 biologically independent samples) and MCSF (n = 3 biologically independent samples) treated monocytes after RNAseq and Partek flow analysis. b t-sne plot showing clustering of MUC1-ST and MCSF treated monocyte transcriptomes (n = 3). c Volcano plot showing the fold change and significance (FDR) of differentially expressed genes in matched MCSF and MUC1-ST macrophages (n = 3 biologically independent samples). Low expressed genes removed (see Supplementary Data 1; tab 3). d Top 50 differentially expressed genes between matched MUC1-ST and MCSF macrophages. Low expressed genes removed (see Supplementary Data 1; tab 3). e As (d) but bottom 50 expressed genes. f CXCL5 and SERPINE1 transcript expression in matched monocytes treated with MCSF (n = 3 biologically independent samples) or MUC1-ST (n = 3 biologically independent samples) for 7 days in serum-free media. g CXCL5 and PAI-1 protein levels in the supernatant of monocytes treated with MUC1-ST or MCSF for 7 days in serum-free media (n = 14 biologically independent samples). h CXCL5 and PAI-1 levels in the supernatant of monocytes treated with MUC1-ST or desialylated MUC1-ST (MUC1-T) for 7 days in serum-free media (n = 4 biologically independent samples). i CXCL5 (n = 8 biologically independent samples) and PAI-1 (n = 3 biologically independent samples) levels in the supernatant of MUC1-ST macrophages pre-treated with anti-Siglec-9 antibodies or isotype control. j CXCL5 levels in the supernatant of monocyte/T47D (±neuraminidase pre-treatment; NA) cocultures after 48 h of co-culture at a 5:1 ratio, n = 2 biologically independent samples with technical triplicate. k CXCL5 levels in the supernatant of monocyte/T47D or monocyte/T47D (core 2) cocultures after 48 h of co-culture at a 5:1 ratio. Representative of two independent experiments. Standard error of mean shown and paired t test used for statistical analysis. TPM transcripts per million.

