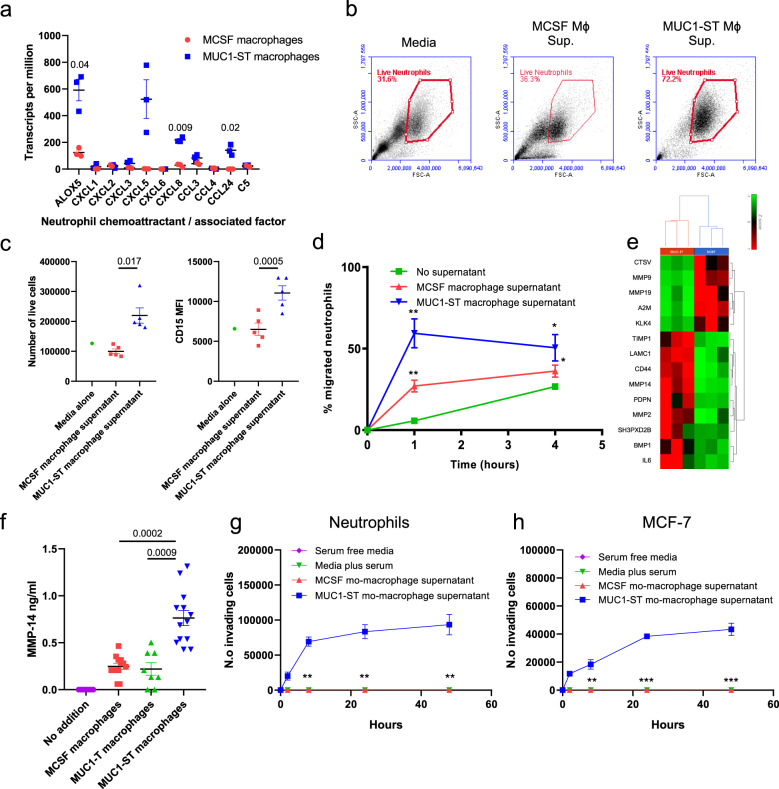
Fig. 4. MUC1-ST macrophages can sustain neutrophils and induce their migration and invasion.
a Neutrophil chemoattractant or associated factor transcript expression level in MUC1-ST macrophages (n = 3 biologically independent samples) and MCSF macrophages (n = 3 biologically independent samples). b Example FSC/SSC plots of primary neutrophils 48 h after being cultured in indicated media or supernatant (n = 5 biologically independent samples). ‘Live neutrophils’ were defined as live using a viability dye. c Numbers and phenotype of live neutrophils 48 h after being cultured in indicated media or supernatant (n = 5 biologically independent samples). ‘Live cells’ were defined as live using a viability dye. d Migration of neutrophils towards indicated media or supernatant over indicated time period (n = 5 biologically independent samples). e Heatmap showing differentially expressed extracellular matrix disassembly genes (GO:0022617) in MUC1-ST (n = 3 biologically independent samples) and MCSF (n = 3 biologically independent samples) macrophages. f MMP14 protein levels in supernatant of monocytes treated with indicated factors for 7 days (n = 13 biologically independent samples; desialylated MUC1-ST, MUC1-T, n = 8 biologically independent samples). g Number of neutrophils invading through basement membrane extract towards the indicated media or supernatant at the indicated time points (n = 5 biologically independent samples). h Number of breast cancer cells (MCF-7) invading through basement membrane extract towards the indicated media or supernatant at the indicated time points (n = 5 biologically independent samples). Standard error of mean shown and paired t test used for statistical analysis.

