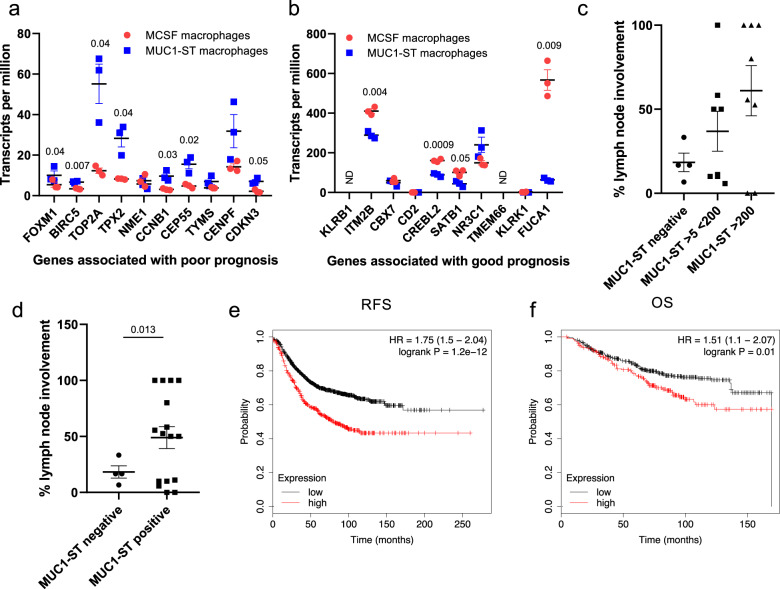
Fig. 7. MUC1-ST differentially expressed genes are associated with poor clinical outcome.
a Top ten genes associated with a poor prognosis or b good prognosis (described in Gentles et al.25), expressed by MUC1-ST macrophages (n = 3 biologically independent samples) or MCSF macrophages (n = 3 biologically independent samples). c, d Percentage of lymph nodes positive for cancer in relation to their primary cancer MUC1-ST score (n = 20 breast cancer cases), c 3 groups, d 2 groups. e, f A 9 gene signature was derived from top genes (fold change) from the differential expression analysis of MCSF macrophages and MUC1-ST macrophages (fold change > 2, p value > 110), and was applied to the BRCA TCGA RNAseq database to generate Kaplan Meier survival curves (Upper third; high signature expression. Lower two thirds; low signature expression). e Relapse free survival (RFS); f overall survival (OS). ND not detected. Standard errors of the mean shown. a, b Statistical analysis using paired t test. c Statistical analysis using unpaired t test with Welch’s correction owing to unequal population variance.

