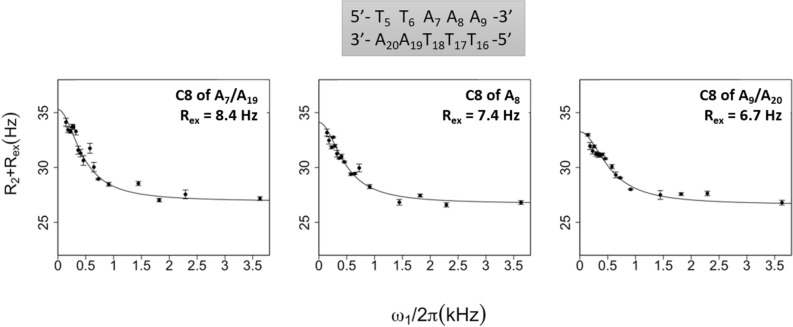
Figure 4.
On-resonance R1ρ relaxation dispersion profiles of adenine C8 atoms. R1ρ (= R2 + Rex) rates of the C8 atoms of adenines were plotted as a function of the effective spin-lock field power (ω1/2π). The experiments were performed at 25 °C. The two-state model fits (solid lines) were obtained using the protocol described in “Materials and Methods”. (R2 + Rex) standard deviations were calculated from the 500 runs carried out for each fit. The averaged Rex values are specified in each panel.

