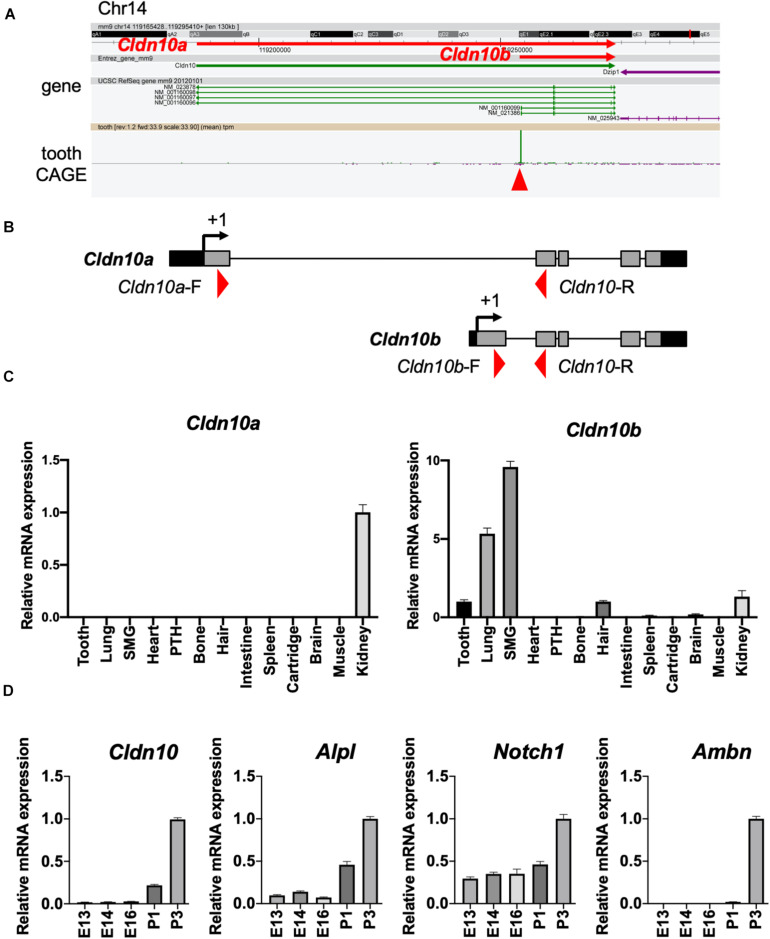
FIGURE 2.
Expression patterns of Cldn10 during tooth development. (A) Genomic locus of mouse Cldn10 in Cap Analysis Gene Expression (CAGE). The CAGE dataset from tooth germs showed a high peak at the Cldn10b transcription start site. The red arrowhead indicates the CAGE peak. (B) Schematic summary of Cldn10 isoforms in the rat genomic locus. Red arrowheads indicate the locations of intron-spanning primers used in quantitative reverse transcription polymerase chain reaction (RT-qPCR). (C) Expression levels of Cldn10 mRNA isoforms a and b in postnatal (P) day P7 rat tissues (n = 3). The relative mRNA expression was standardized to Gapdh expression. Error bars represent S.D. SMG, submandibular gland; PTH, parathyroid. (D) mRNA expression levels of Cldn10, SI cell markers Alpl and Notch1, and ameloblast marker Ambn at different developmental stages of mouse tooth germ (n = 3). The relative mRNA expression was standardized to Gapdh expression. Error bars represent S.D.

