FIGURE 4.
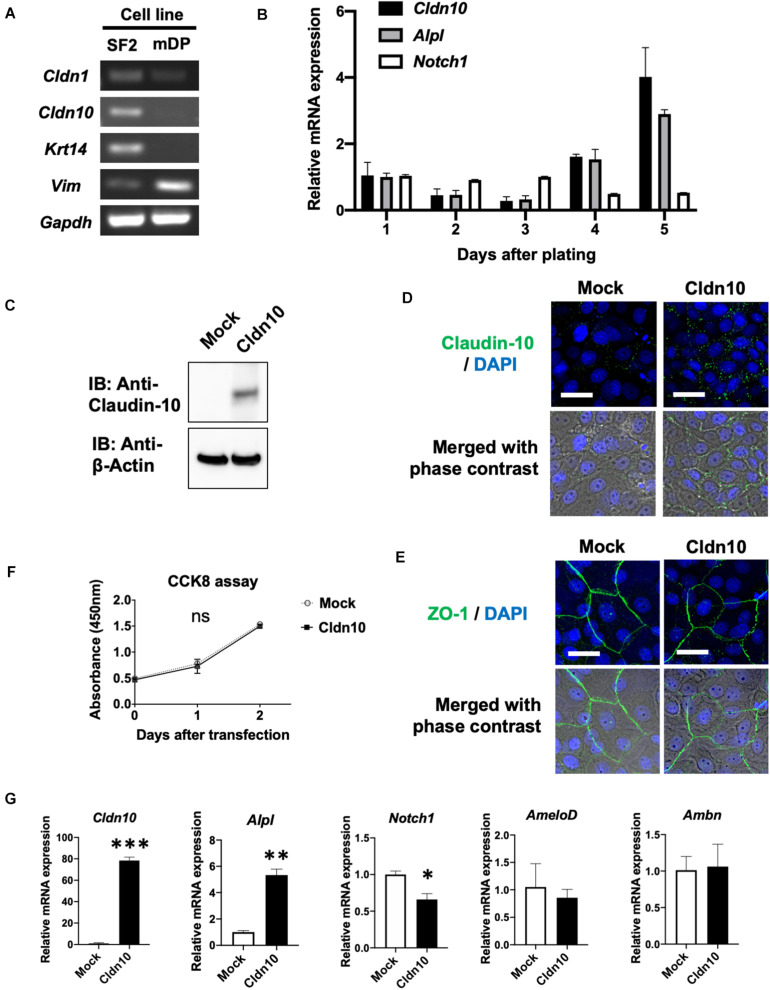
Overexpression of claudin-10b enhances differentiation of rat incisor-derived dental epithelial SF2 cells into the stratum intermedium (SI) cell lineage. (A) Reverse transcription polymerase chain reaction (RT-PCR) analysis of Cldn1, Cldn10, Krt14, and Vim expression in SF2 cells and a mouse dental papilla (mDP) mesenchymal cell line. Krt14 and Vim were used as representative epithelial and mesenchymal marker genes, respectively. (B) Time-course analysis of Cldn10, Alpl, and Notch1 expression in SF2 cells using quantitative RT-qPCR (n = 3). Relative mRNA expression was standardized to Gapdh expression. Error bars represent S.D. (C) SF2 cells were transfected with a mock control vector or a Cldn10b expression vector. Western blot analysis showed high expression levels of claudin-10 protein in Cldn10b-overexpressing SF2 cells. (D) Immunofluorescence of Claudin-10 in mock-transfected and Cldn10b-overexpressing SF2 cells. Upper panel: Green, claudin-10; blue, DAPI. Lower panel: merged image with phase contrast from upper panel. Scale bars, 10 μm. (E) Immunofluorescence of ZO-1 in mock-transfected and Cldn10b-overexpressing SF2 cells. Upper panel: Green, ZO-1; blue, DAPI. Lower panel: merged image with phase contrast from upper panel. Scale bars, 10 μm. (F) Cell Counting Kit-8 (CCK-8) assay of mock-transfected and Cldn10b-transfected cells revealed similar proliferation rates (n = 3). Error bars represent S.D. ns (not significant), p > 0.05 with two-way ANOVA. (G) Expression of Alpl, Notch1, AmeloD, and Ambn in Cldn10b-overexpressing SF2 cells (n = 3). Error bars represent S.D. ∗p < 0.05; ∗∗p < 0.01; ∗∗∗p < 0.001 with two-tailed t-test.

