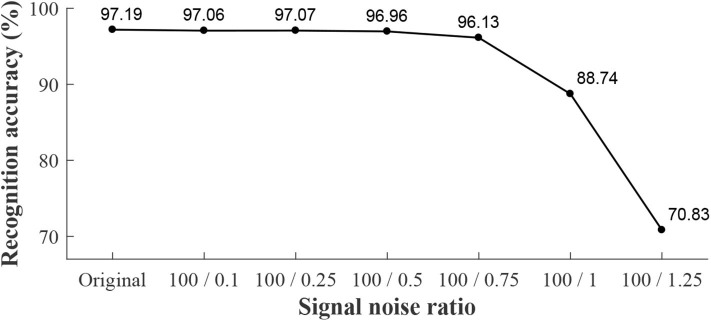
Figure 9.
Robustness analysis (off-line) of recognition for locomotion modes. The horizontal axis denotes the signal noise ratio, which represents the noise added by manual into original data. Here, “Original” denotes the original data without added noise. The text in this figure denotes the recognition accuracy.

