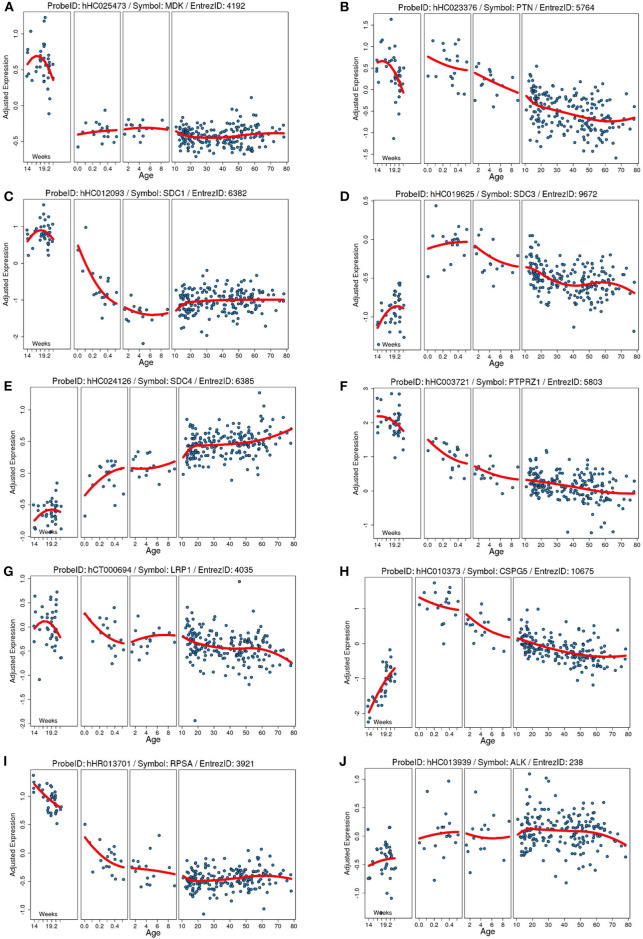
Figure 1.
Developmental expression of human mRNA in the cortex for our proteins of interests and known receptors. Each plot shows the gene expression from a frontal cortical sample on the Y axis (age) adjusted to the total average global gene expression across timepoints. Each blue dot is an individual human sample, and the red line is the moving average of gene expression. Age on the Y axis is in weeks of gestation (far right) and then in years after birth. (A) Midkine (MDK). (B) Pleiotrophin (PTN). (C) Syndecan-1 (SDC1). (D) Syndecan-3 (SDC3). (E) Syndecan-4 (SDC4). (F) Protein tyrosine phosphatase ζ (PTPRZ1). (G) Low-density lipoprotein receptor-related protein (LRP1). (H) Neuroglycan C/chondroitin sulfate proteoglycan 5 (CSPG5). (I) Laminin binding protein precursor/40S ribosomal protein SA (RPSA). (J) Anaplastic lymphoma kinase (ALK). Data collated from the http://braincloud.jhmi.edu/.

