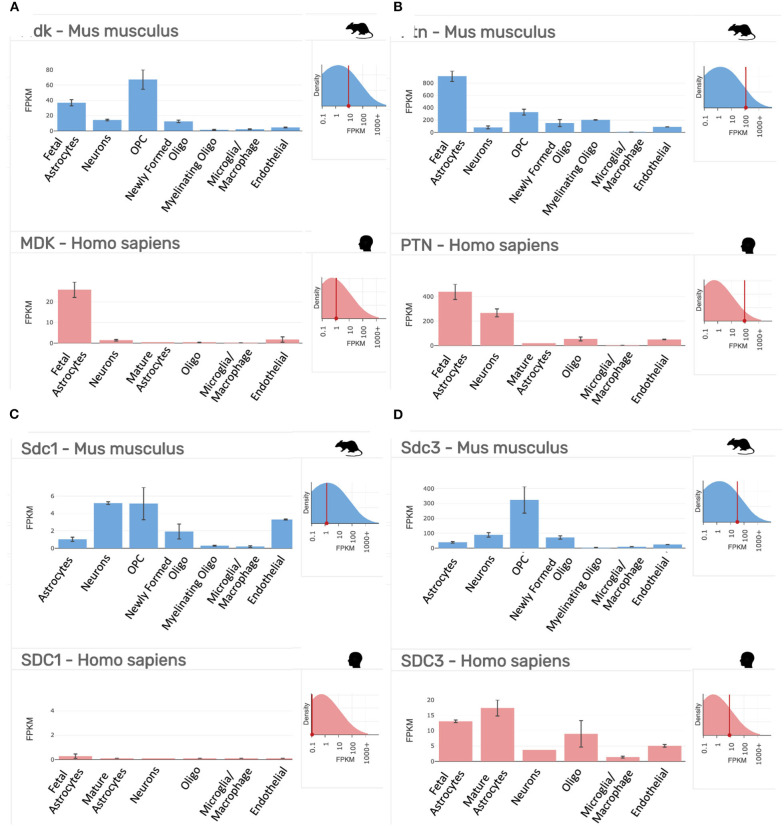
Figure 2.
Gene expression profiling data of our targets of interest in purified cell populations from the mouse (Mus musculus, blue) and human (Homo sapiens, red) at stages of development as indicated. (A) Midkine (Mdk/MDK). (B) Pleiotrophin (Ptn/PTN). (C) Syndecan-1 (Sdc1/SDC1). (D) Syndecan-3 (Sdc3/SDC3). FPKM, fragments per kilobase of transcript per million mapped reads = the relative expression of a transcript. Top right inset on each panel shows the overall expression of the gene relative to all transcripts in the analysis. Data collated from the http://www.brainrnaseq.org/.

