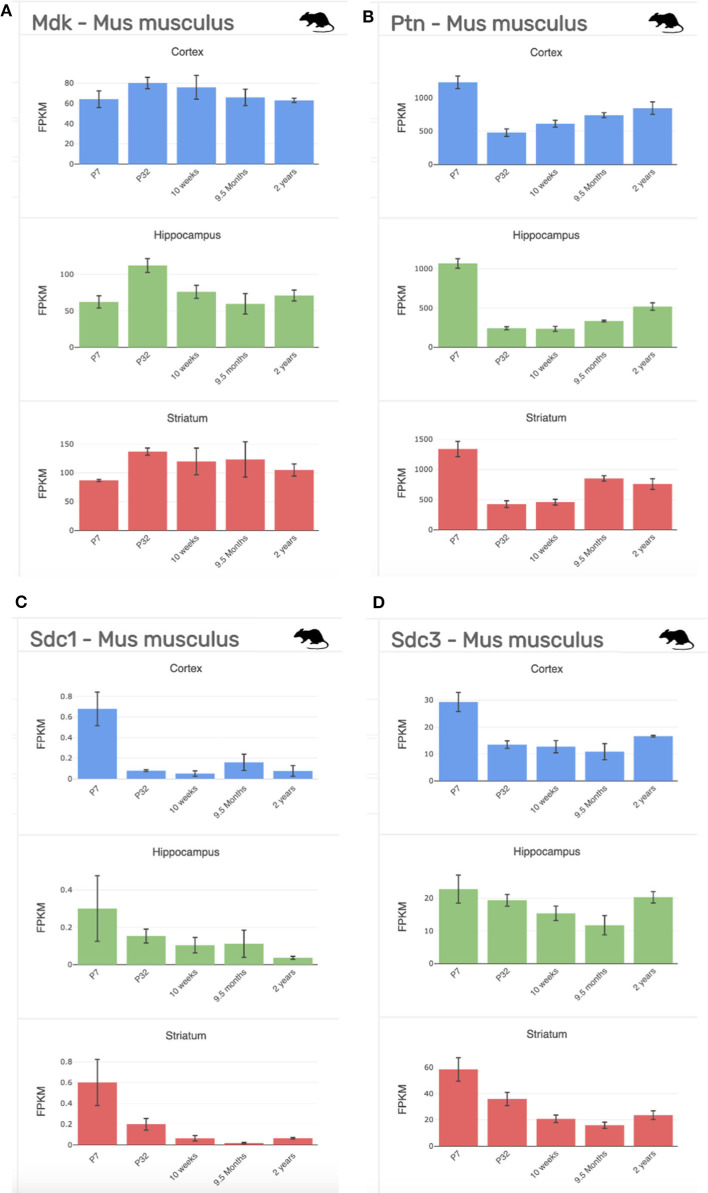
Figure 5.
Gene expression profiling data of our targets of interest at stages across development (P7-2 years) and across regions of the brain (cortex, blue; hippocampus, green; striatum, red) from the mouse (Mus musculus). (A) Midkine (Mdk). (B) Pleiotrophin (Ptn). (C) Syndecan-1 (Sdc1); (D). Syndecan-3 (Sdc3). FPKM, fragments per kilobase of transcript per million mapped reads = the relative expression of a transcript. Data collated from http://www.brainrnaseq.org/.

