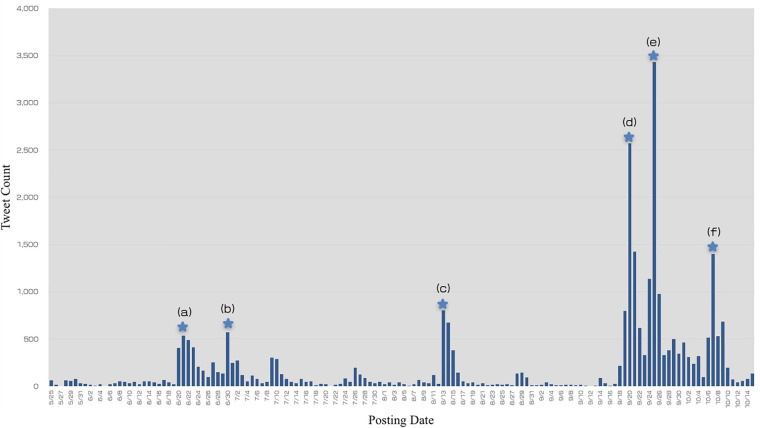
FIGURE 1.
Changes in the daily number of tweets. This figure shows the number of tweets in chronological order from May 15 to October 15. The bars represent the total tweet count including original tweets, reply tweets, and retweets. Prominence of peaks (a–f) were identified with Python (version 3.7.6) using the SciPy 1.4.1.

