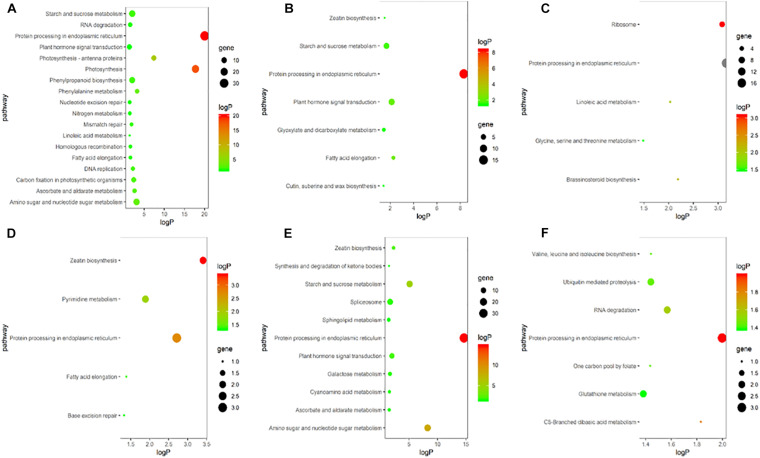
FIGURE 5.
KEGG enrichment bubble chart of differentially expressed genes in ears under heat stress. (A–C) represent T in V9, V12, and VT stage, respectively. (D–F) represent S in V9, V12, and VT stage, respectively. The X-axis is the enrichment factor (enriched to the differentially expressed genes in these pathway/background genes in this pathway), the Y-axis is the description of the corresponding pathway, the size of bubble represents the number of differentially expressed genes, and the color of bubble represent the P value.

