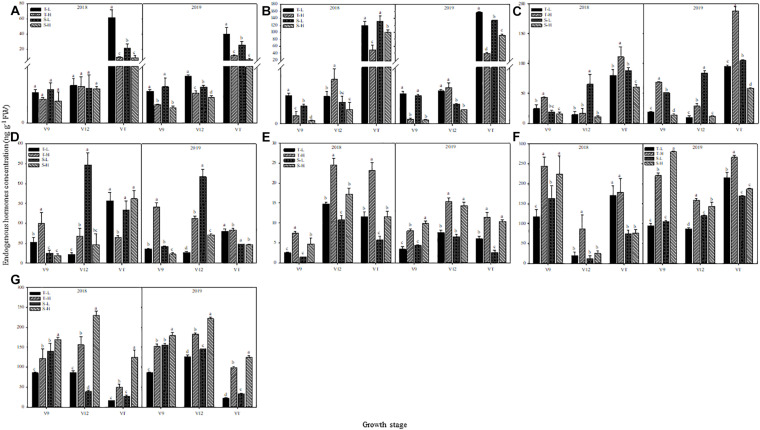
FIGURE 8.
Effect of heat stress on the concentration of zeatin (A), zeatin riboside (B), salicylic acid (C), jasmonic acid (D), gibberellin acid3 (E), gibberellin acid4 (F), and abscisic acid (G) in ears. T and S represent the heat-tolerant variety and the heat-sensitive variety, respectively. L represents the natural environment and H represents the heat-stressed environment. V9, V12, and VT represent the 9th leaf, 12th leaf, and tasseling stages. Vertical bars represent ± SD of the mean. a, b, c, and d indicate significant difference among different treatments (n = 3, P < 0.05).

