
FIGURE 2.
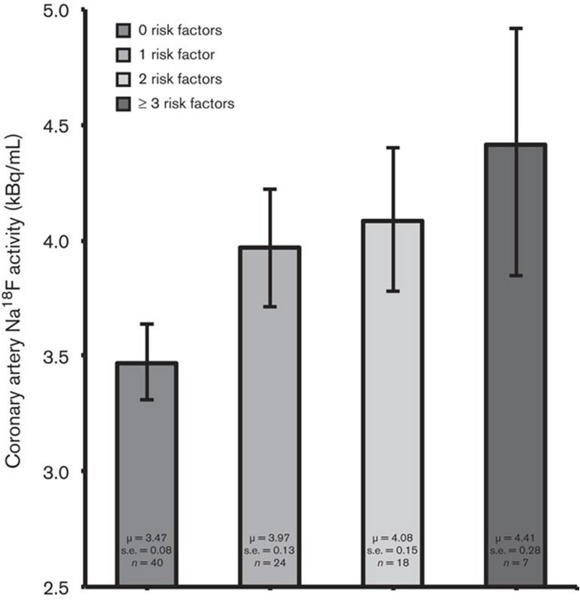
NaF uptake in relation to cardiovascular risk factors. Bar graph showing coronary artery NaF uptake (kBq/ml), adjusted for blood NaF activity, injected NaF dose, and PET/CT technology, in relation to the number of cardiovascular risk factors (i.e., BMI, systolic blood pressure, serum triglyceride concentration, and serum low-density lipoprotein-cholesterol concentration) present. Coronary NaF uptake increased linearly according to the number of risk factors present (P < 0.001 for a linear trend). Coronary NaF uptake was significantly lower in the absence of risk factors compared with the presence of one or more risk factors (3.47 vs. 3.97, 4.08, and 4.41 kBq/ml, respectively; P < 0.001). Error bars represent the 95% confidence interval of the mean (Reproduced from Blomberg et al. (Figueroa et al., 2013) with permission).