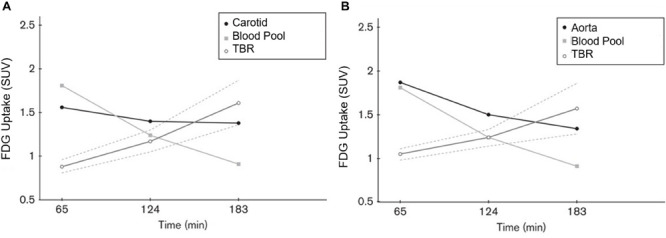
FIGURE 5.

Graph plotting the FDG activity (SUV) in the carotid arteries (A), aorta (B) and the right atrial blood pool at 65, 124, and 183 min after FDG administration. The ratio between the arterial and blood pool activity increased with time. The interrupted lines represent the 95% confidence interval of TBR values. We would like to emphasize the TBR measurements differ at 1, 2, and 3 h. This indicates the lack of reliability of TBR for accurate quantification of uptake in the atherosclerotic plaques (Reproduced from Blomberg et al. (van der Wal and Becker, 1999) with permission).
