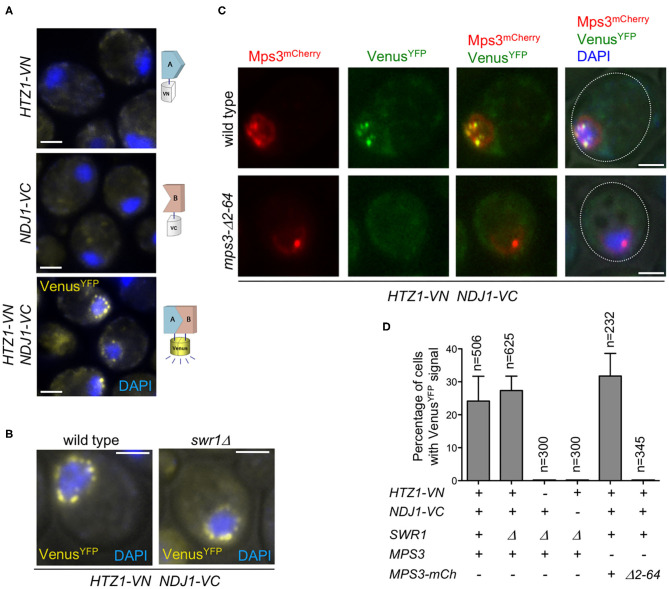
Figure 3.
Analysis of H2A.Z and Ndj1 interaction by bimolecular fluorescence complementation (BiFC) assay. (A,B) H2A.Z and Ndj1 interact at the nuclear periphery. Microscopy fluorescence images of cells expressing HTZ1 fused to the N-terminal half of the VenusYFP (VN) and/or NDJ1 fused to the C-terminal half of the VenusYFP (VC) as indicated. Nuclei are stained with DAPI (blue). The reconstitution of VenusYFP fluorescence resulting from H2A.Z-VN/Ndj1-VC interaction appears in yellow. Images were taken 16 h after meiotic induction. The strains in (A) are: DP1540 (HTZ1-VN), DP1541 (NDJ1-VC), and DP1493 (HTZ1-VN NDJ1-VC swr1Δ). The strains in (B) are: DP1496 (HTZ1-VN NDJ1-VC) and DP1493 (HTZ1-VN NDJ1-VC swr1Δ). (C) H2A.Z and Ndj1 interaction at the nuclear periphery depends on the 2–64 N-terminal domain of Mps3. Mps3-mCherry signal is shown in red, VenusYFP in green, and DAPI in blue. The cells were imaged 16 h after meiotic induction. The strains in (C) are: DP1511 (MPS3-mCherry HTZ1-VN NDJ1-VC) and DP1512 (mps3-Δ2-64-mCherry HTZ1-VN NDJ1-VC). A single medial plane is shown in (A–C). (D) Quantification of the percentage of cells displaying VenusYFP fluorescent signal in the experiments shown in (A–C). At least three quantification analyses were performed. The total number of cells scored (n) is shown. Error bars, SD. Scale bar, 2 μm.

