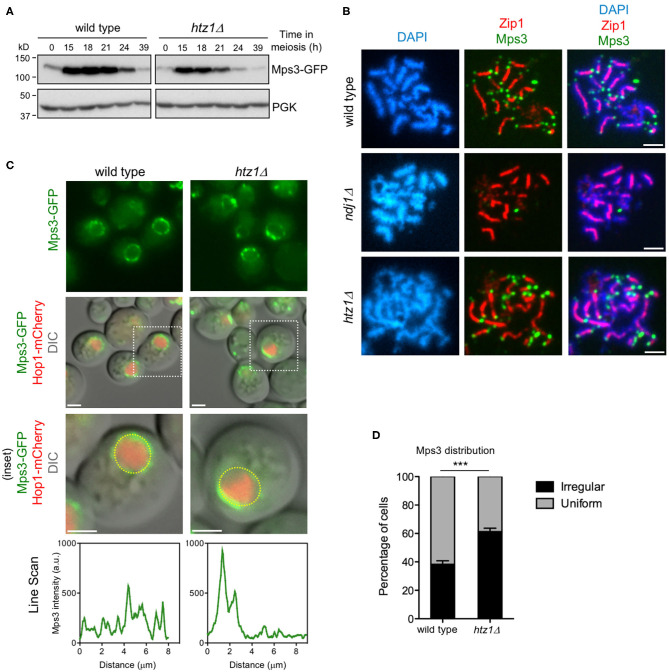
Figure 6.
Altered levels and distribution of Mps3 in the absence of H2A.Z. (A) Western blot analysis of Mps3 production during meiosis detected with anti-GFP antibodies. PGK was used as a loading control. The strains in (A) are: DP866 (wild type) and DP867 (htz1Δ). (B) Immunofluorescence of spread pachytene nuclei stained with DAPI to visualize chromatin (blue), anti-green fluorescent protein (GFP) to detect Mps3 (green), and anti-Zip1 to mark the synaptonemal complex (SC) central region (red). Scale bar, 2 μm. The strains in (B) are: DP866 (wild type), DP1103 (ndj1Δ), and DP867 (htz1Δ). (C) Microscopy fluorescence images of cells expressing MPS3-GFP and HOP1-mCherry. The presence of Hop1-mCherry was used to detect meiotic prophase cells. Stacks of images in the Z-axis were taken, but a single central plane from representative cells is shown. The line scan plots represent the GFP signal along the depicted yellow circle line in the bottom row cells. Scale bar, 2 μm. (D) The distribution of Mps3 was analyzed in maximum-intensity projections from images obtained as in (C). Two categories were established: uniform and irregular. Cells scored as “uniform” display Mps3-GFP signal homogeneously distributed. Cells scored as “irregular” display Mps3-GFP signal concentrated to one area of the nuclear envelope (NE). Only cells displaying the Hop1-mCherry signal were considered in the analysis. This quantification was performed in triplicate. Student's t-test: P = 0.0003 (***). A total of 383 and 387 cells were scored for wild type and htz1Δ, respectively. The strains in (C,D) are: DP1032 (wild type) and DP1033 (htz1Δ).

