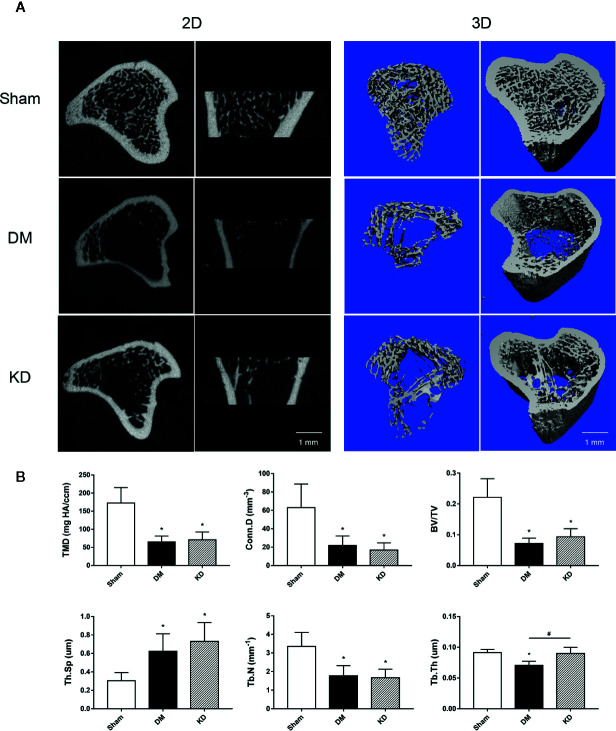
Figure 2.
The micro-CT pictures and bone parameters of cancellous bone in the proximal tibia. (A) The 2D and 3D pictures of bone microstructures in the sham, diabetes mellitus (DM) and ketogenic diet (KD) groups. (B) The trabecular parameters of cancellous bone among groups. “*” means P < 0.05 compared to sham group, “#” means P < 0.05 between the DM and KD groups.

