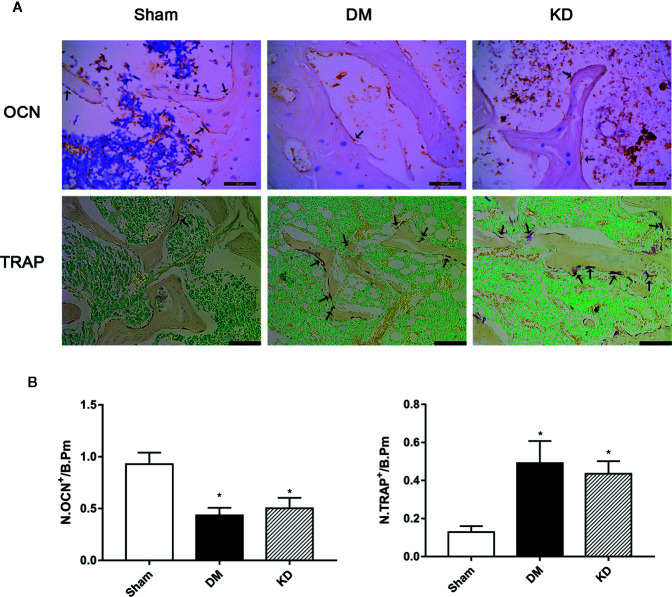
Figure 7.
The osteocalcin (OCN) and tartrate-resistant acid phosphatase (TRAP) staining in the proximal tibia (A), and the results of semi-quantitative analysis (B). The activity of the osteoblast cell was significantly decreased, while the osteoclast cell was increased in diabetes mellitus (DM) and ketogenic diet (KD) groups. There was significantly lower expression of OCN and remarkably higher expression of TRAP in both DM and KD groups compared with the sham group (arrows refer to positive cells). “*” means P < 0.05 compared to sham group.

