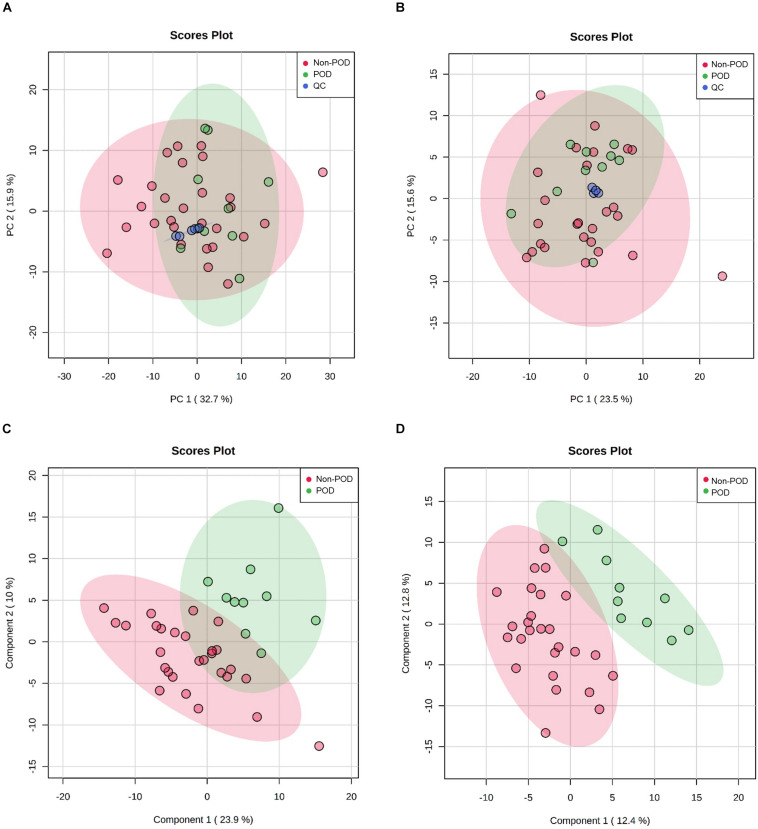
FIGURE 3.
Untargeted lipidomics profiling of CSF samples in POD patients and Non-POD patients. PCA (A: positive-ion mode; B: negative-ion mode) and PLS-DA (C: positive-ion mode; D: negative-ion mode) analyses of the DDA-based lipidomics data. The indicated groups are presented by different colors (green: POD; red: Non-POD; blue: QC).

