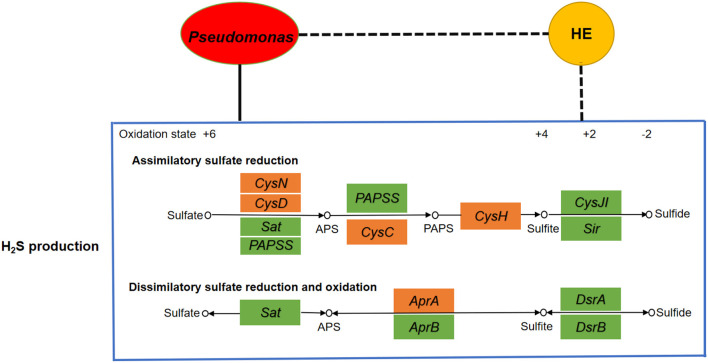
Figure 2.
Analyses of correlation network among microbiota, H2S production, and HE. If the correlation is negative, the connecting line is black with dashes, whereas if positive, it is black. The yellow node represents hepatic encephalopathy, whereas the red one is the microbial community Pseudomonas. The big blue box shows the H2S production including assimilatory sulfate reduction pathway and dissimilatory sulfate reduction and oxidation pathway. The little boxes in green or orange represent genes, and the ones in orange are highly correlated with Pseudomonas. It clearly indicates a positive correlation between Pseudomonas and H2S production as well as a negative correlation between HE and H2S production.

