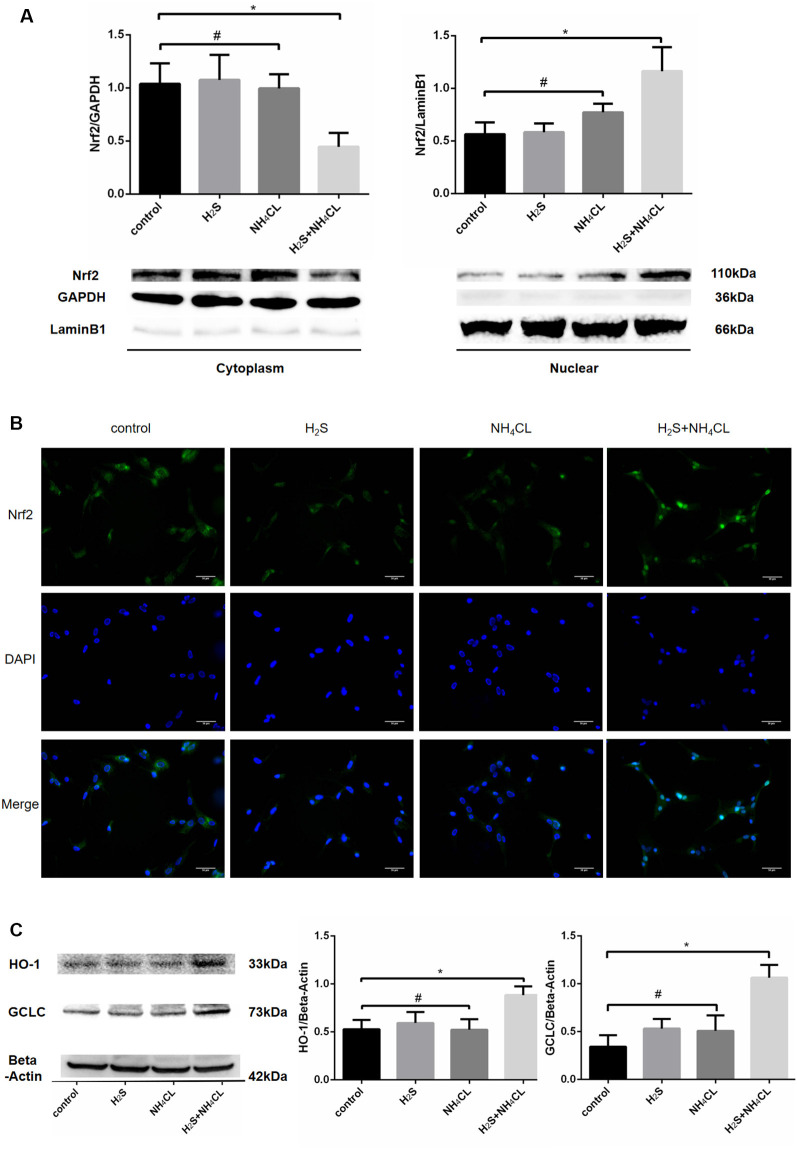
Figure 6.
Activation of Nrf2 signaling by H2S during NH4Cl-induced toxicity in astrocytes. Panel (A) shows the expression of Nrf2 in the cytoplasm (left) and nucleus (right) with histograms on the top and typical Western blot pictures at the bottom. Panel (B) displays the immunostaining of Nrf2 and DAPI as well as merge pictures in astrocytes treated with control, H2S, NH4Cl, and combination of H2S and NH4Cl, respectively. Panel (C) indicates the expression of Nrf2 downstream genes HO-1 and GCLC treated with control, H2S, NH4Cl, and combination of H2S and NH4Cl, respectively, with typical Western blot picture on the left and histograms on the right. Data are presented as mean ± SEM of three independent experiments. *P < 0.05, and #P > 0.05.

