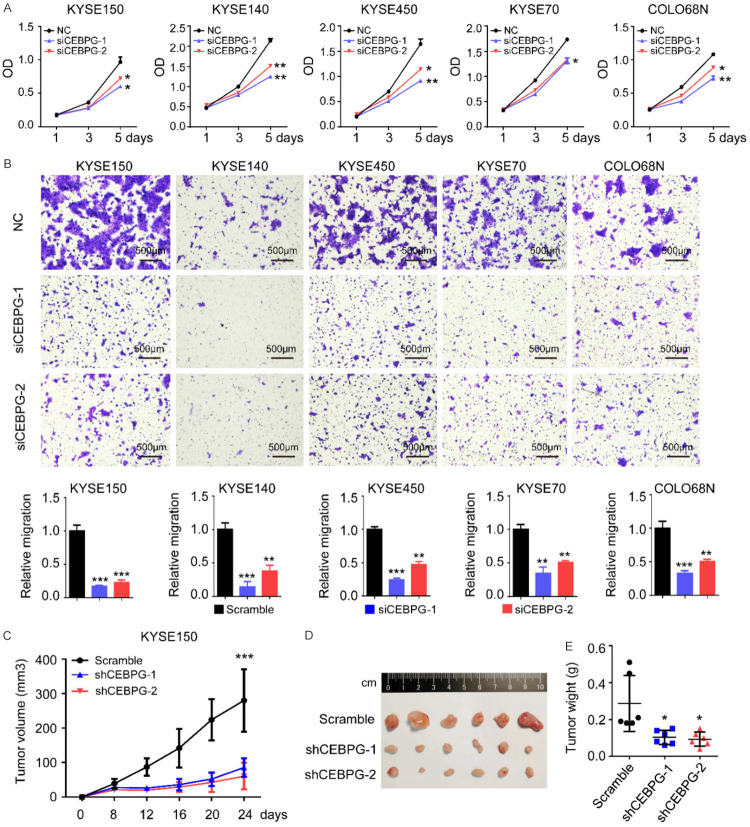
Figure 3.
CEBPG promotes ESCC cell proliferation, migration and tumor growth in vivo. (A) Proliferation curves and (B) representative images of transwell assay results of KYSE150, KYSE140, KYSE450, KYSE70, and COLO68N cell lines with the presence or absence of CEBPG knockdown. Above: the schematic diagram; Bottom: a statistical graph. Data were shown as Mean ± SD. Unpaired t test. *, P<0.05; **, P<0.01; *** P<0.001. (C) Growth curves of the xenograft tumors, (D) tumor images and (E) tumor weight measured at the end point of the in vivo experiments. N=6. Unpaired t test. *, P<0.05; ***, P<0.001.

